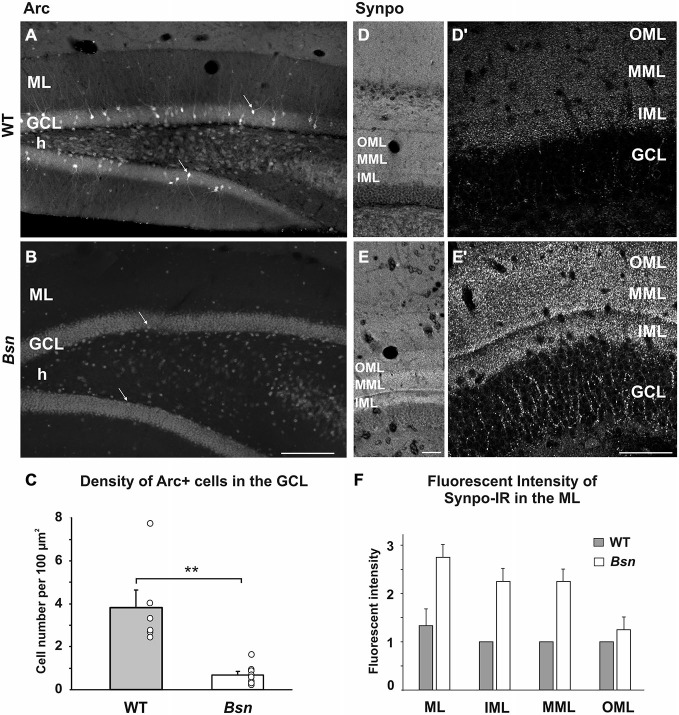
Figure 4.
Differential effects of neuronal network hyperexcitability on markers of synaptic plasticity. (A–C) Density of Arc+ cells in the DG. (A) Varying degrees of Arc-staining intensity were found in a subset of granule cells (arrows) in the WT DG. (B) Only a few Arc+ granule cells were observed in the Bsn-mutant. (C) Quantification of Arc+ cells in the DG revealed a significant reduction in Bsn-mutants compared to WT mice. (D–F) SI of Synpo-IR in the DG. (D) Uniform distribution of Synpo+ puncta across the sublayers of the ML. (D′) Delineation between the IML and MML can be observed at higher magnification in WT mice. (E) Increased Synpo-IR intensity of the MML and IML in the Bsn-mutant DG. Note the even stronger delineation between the IML and MML in (E′). Synpo staining in the GCL is also increased. (F) Grading of Synpo-IR intensity confirms a relative increase in fluorescence intensity in the inner two thirds of the ML in Bsn, while no change was observed between genotypes in the OML (Intensity scale: 0, no signal; 1, weak; 2, moderate; 3, strong signal). Data are shown as mean ± SEM. **p < 0.01. Scale bars: A,B = 200 μm; D,D′,E,E′: 100 μm. Abbreviations: ML, molecular layer; GCL, granule cell layer; h, hilus, Synpo, Synaptopodin; OML, outer molecular layer; MML, middle molecular layer; IML, inner molecular layer.

