Figure 5.

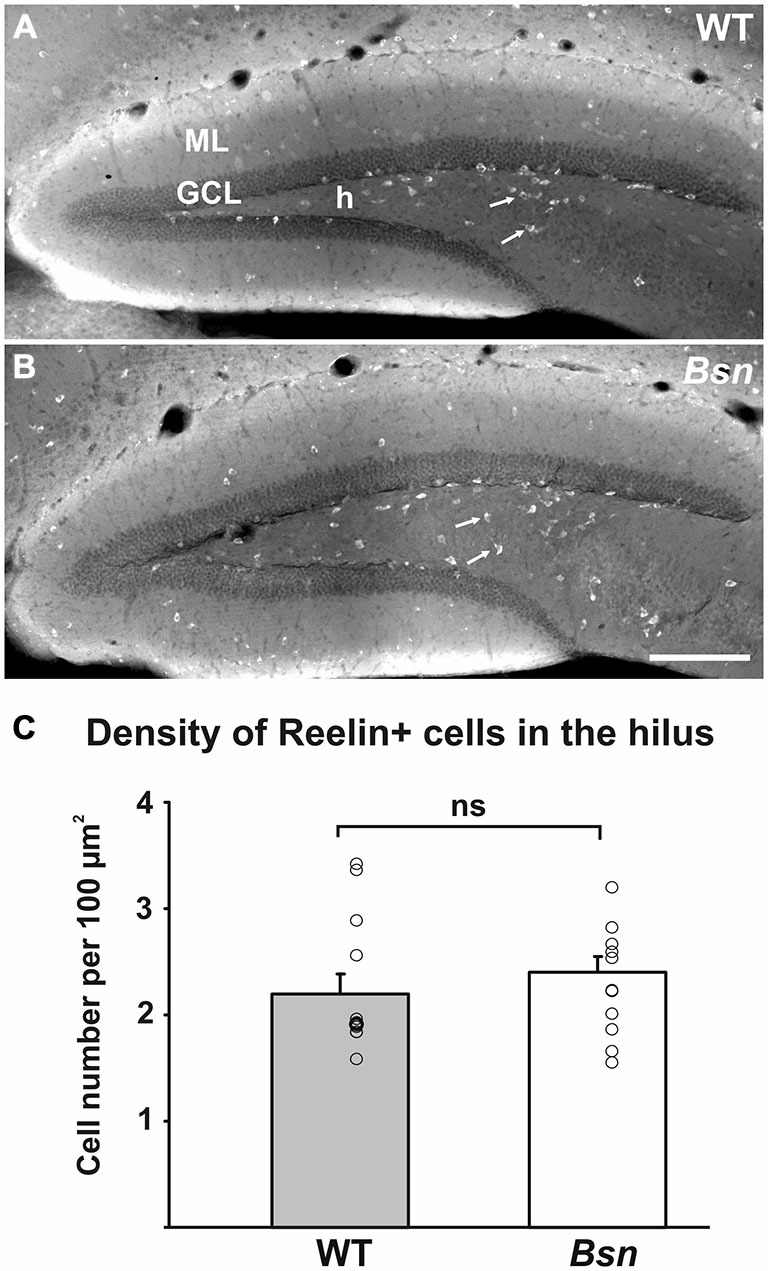
Distribution of Reelin immunoreactivity in the DG is comparable between WT and Bsn-mutant mice. Distribution of Reelin+ neurons (arrows) in the (A) WT and (B) Bsn-mutant DG. (C) Measurement of Reelin+ neuron density in the hilus revealed a lack of significant difference between genotypes. Data are shown as mean ± SEM. Circles represent single data points. Scale bar = 200 μm. Abbreviations: ML, molecular layer; GCL, granule cell layer; h, hilus; ns, not significant.
