Figure 7.

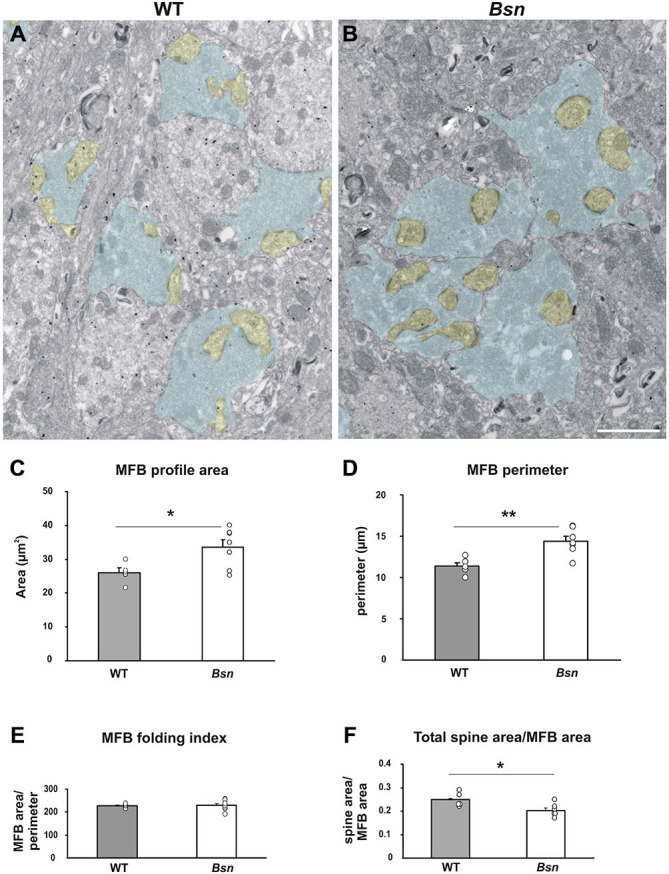
Mossy fiber boutons from Bassoon mutants are enlarged compared to those from WT animals. Representative electron micrographs of stratum lucidum in (A) WT mice vs. (B) Bsn-mutants. Selected MFB profiles are shaded in blue, while the corresponding spine profiles are shaded yellow. Note the larger MFB profiles in B (compared to A). Morphometric analysis of MFB profiles confirmed a significant increase in the area (C) and perimeter (D) of Bsn-mutant MFBs compared to WT mice, while the folding index (area/perimeter) remain unchanged (E). (F) Graph showing that the increase in MFB area is not accompanied by an increase in the area of the complex spines contacting the corresponding bouton. Bar graphs represent mean values ± SEM (error bars), circles show individual mean values for each animal analyzed. *p < 0.05, **p < 0.005 (Student’s t-test). Scale bar: (A,B): 2 μm. Abbreviations: MFB, mossy fiber bouton.
