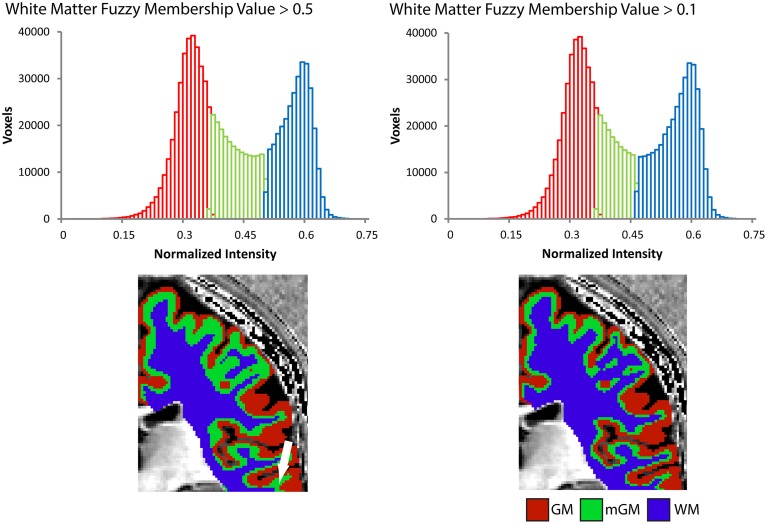
Figure 2.
Tissue segmentation results shown for a representative individual for WM fuzzy c-means threshold values greater than 0.5 or 0.1. Each histogram plots the number of voxels assigned to each class in the cerebrum against normalized MRI signal intensity and each image shows the resulting segmentation superimposed on a 2D slice from the 3D Ratio MRI. Note the improved definition of the gGM/WM boundary in the thin gyral blade of white matter located at the white arrow.

