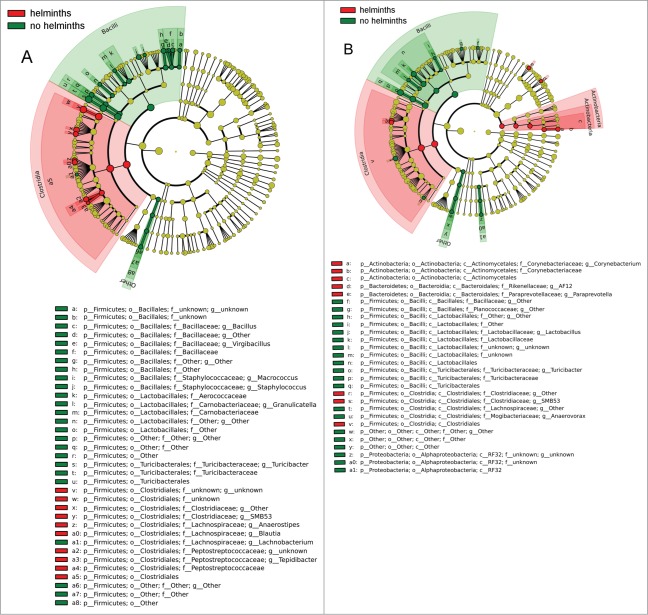
Figure 5.
Cladograms of bacterial lineages with significantly different representation in rats with or without helminths in (A) Group S or (B) Group L. Lineages on the bacterial trees are color-coded to indicate whether the taxon does (red or green) or does not (yellow) significantly differ between sample classes.

