Figure 4.

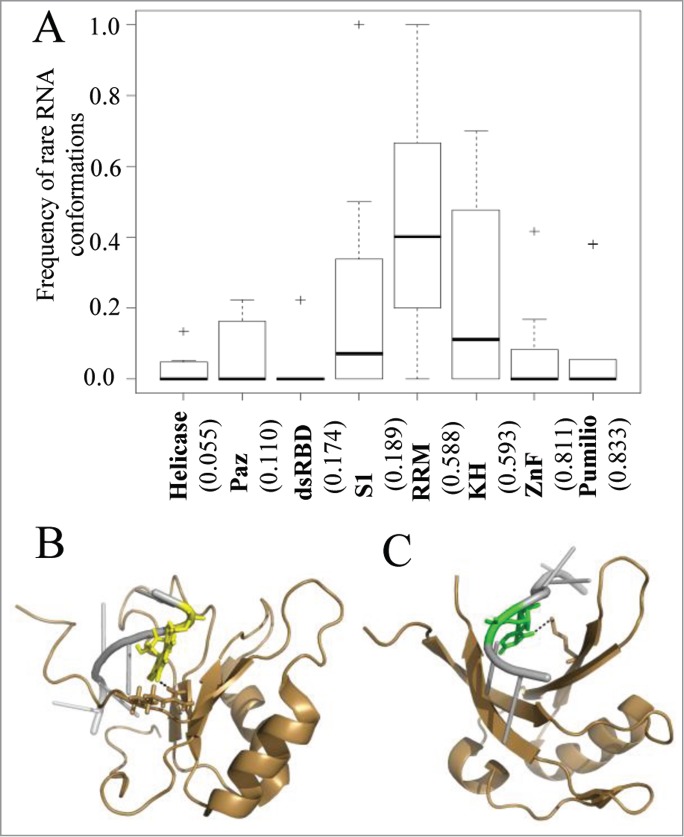
The interplay between sequence specificity and rare RNA conformations. (A) Box plots demonstrate the frequencies of interactions with rare RNA conformations in RNAs from protein-RNA complexes grouped according the interacting RNA binding domain family. The numbers in the x-axis below each plot indicate the calculated average frequency of specific hydrogen bond interactions within each family. In (B and C) are examples of RRM-RNA complexes from the PDB which involve hydrogen bond interactions between the RRM domain and nucleotides with rare conformations. The RNA and protein are colored in silver and sand, respectively. Hydrogen bonds between the protein domain and the RNA are depicted in dashed black lines. (B) Graphical representation of the interactions of the RRM domain with nucleotide in syn conformation (PDB ID 2LEC). Highlighted are the interacting pair G (yellow) and ARG (stick). (C) Graphical representation of the interactions of the RRM domain with nucleotide in C2' endo conformation (PDB ID 2XS2). Highlighted are the interacting pair U (green) and LYS (stick).
