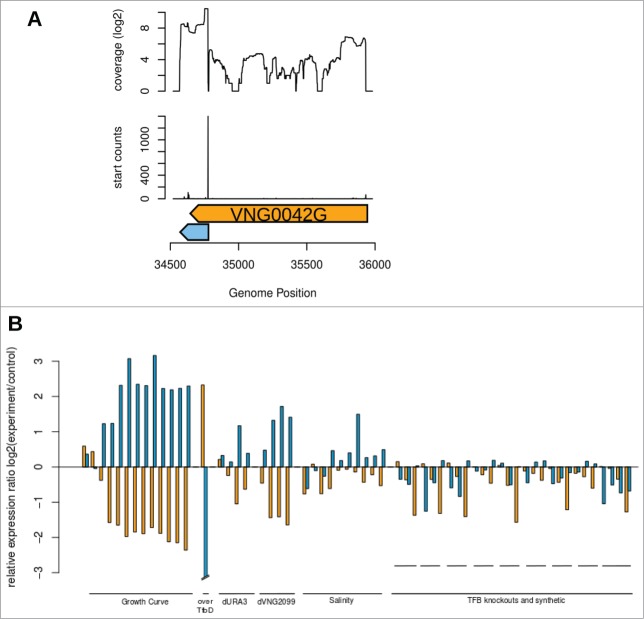
Figure 2.
Analysis of sRNA-seq and expression profiles for VNG0042G and VNG_sot0042. (A) Strand-specific sRNA-seq data5 was used to map the 5' end of sotRNAs in IS1341-type transposases of H. salinarum NRC-1. sRNA-seq data is visualized as log2 of total reads aligned in each genomic position for VNG0042G and VNG_sot0042. Enrichment of 5' ends of mapped reads are visualized as peaks right below small RNA-seq coverage. Light blue arrow: sotRNA. Dark orange arrows: genes annotated on reverse strand. (B) Expression profiles of VNG0042G (orange) and VNG_sot0042 (blue) in different environmental and genetic backgrounds. Each pair of orange/blue columns represent one published experimental condition. Data for the remaining genes and for each individual experiment is available in Supplementary Figure 1. Data for intergenic ncRNAs can be found in Figure 4 and Supplementary Figure 7.

