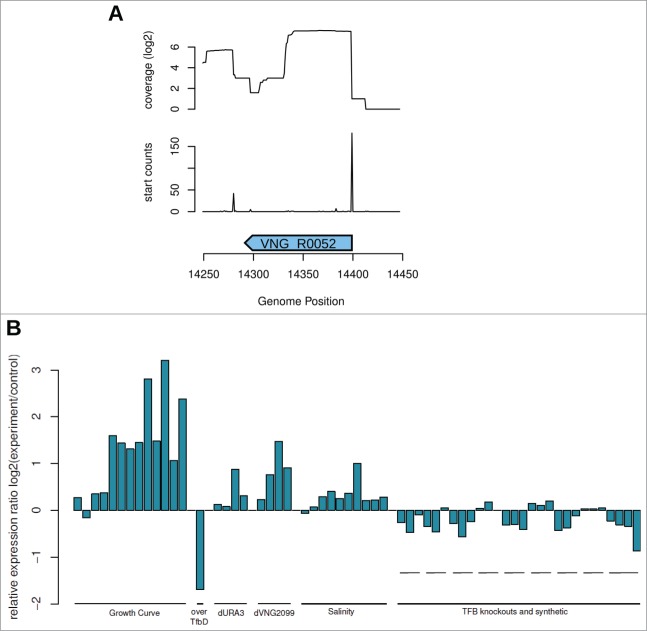
Figure 4.
(A) Strand-specific sRNA-seq data5 was used to map 5' ends of intergenic RNAs in H. salinarum NRC-1. sRNA-seq data is visualized as log2 of total reads aligned in each genomic position for VNG_R0052. Enrichment of 5' ends of mapped reads are visualized as peaks right below small RNA-seq coverage profile. (B) Expression profiles of VNG_R0052 in different environmental and genetic backgrounds.

