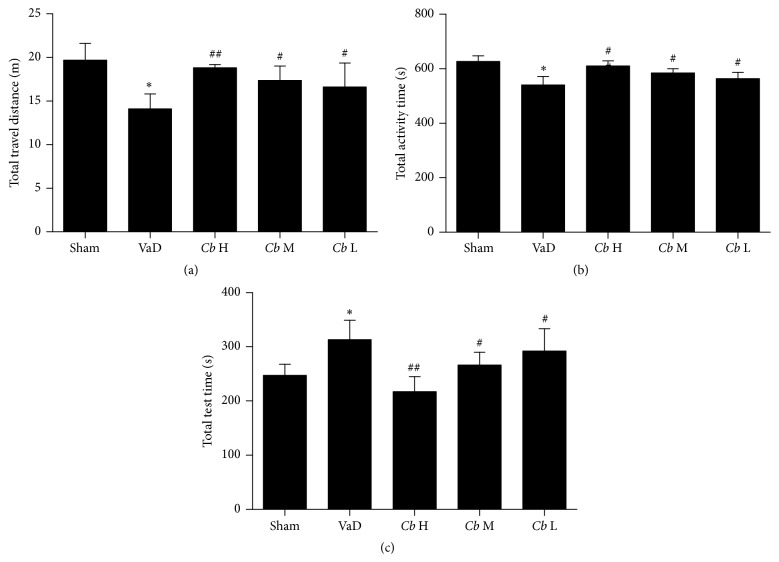
Figure 1.
Open field test. (a) The total distance travelled over 1 h, (b) the time spent in the central area, and (c) the total rest time are presented for each group. Sham, sham-operated group; VaD, VaD model group; Cb H, C. butyricum- (1 × 10⁸ CFU-) treated group; Cb M, C. butyricum- (1 × 10⁷ CFU-) treated group; and Cb L, C. butyricum- (1 × 10⁶ CFU-) treated group. Error bars indicate SEM; ∗ P < 0.05 versus sham group; # P < 0.05 and ## P < 0.01 versus VaD group.

