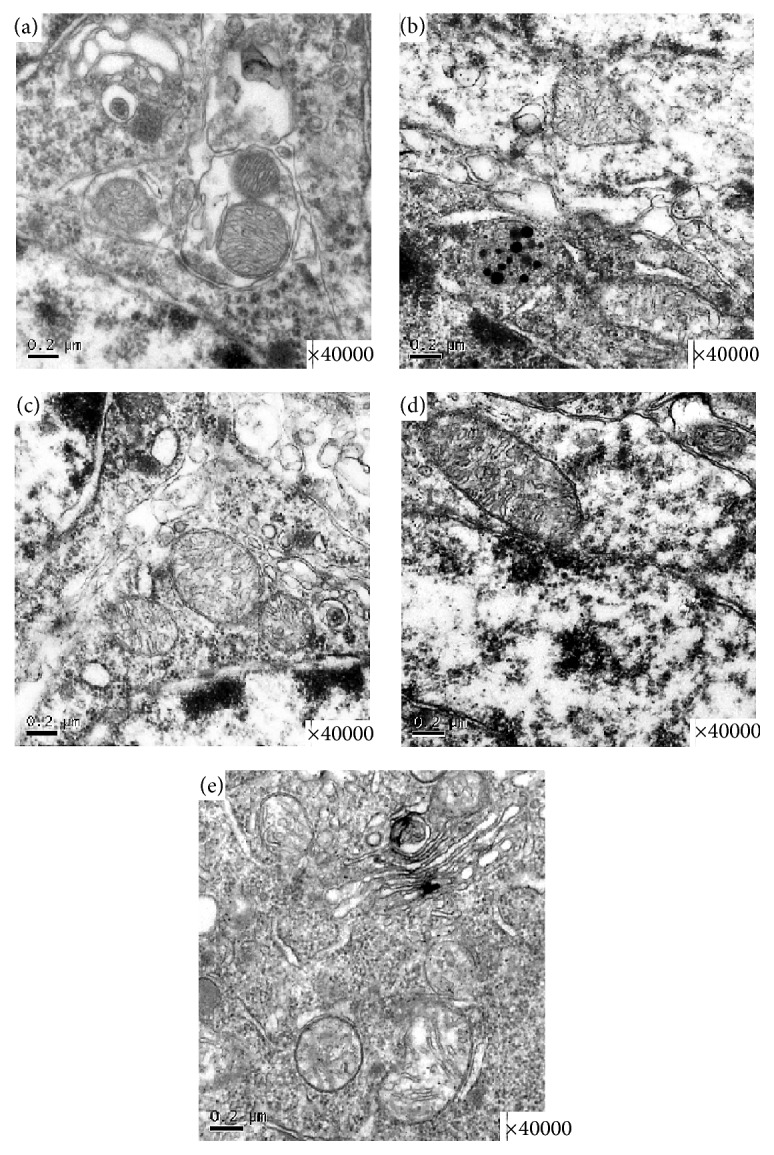
Figure 3.

Representative photomicrographs of the ultrastructural changes observed in brain tissue. (a) A representative nucleolus in a hippocampal neuron of the sham-operated group. (b) A representative nucleolus of cerebral ischemia in the VaD group. (c) A representative nucleolus in the Cb L group, Cb M group (d), and Cb H group (e). Sham, sham-operated group; VaD, VaD model group; Cb H, C. butyricum- (1 × 10⁸ CFU-) treated group; Cb M, C. butyricum- (1 × 10⁷ CFU-) treated group; and Cb L, C. butyricum- (1 × 10⁶ CFU-) treated group.
