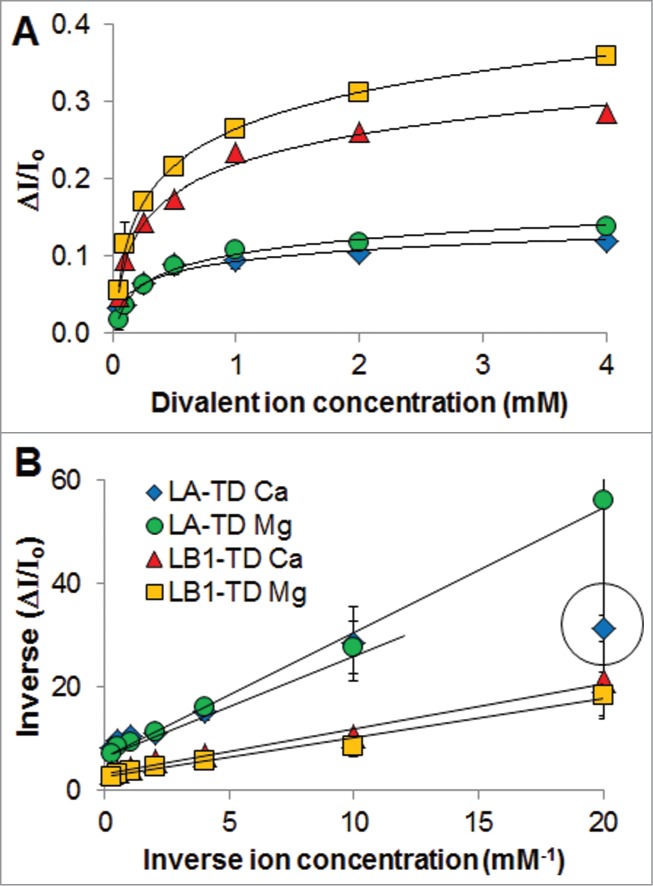
Figure 3.

Binding curves of tail domains with divalent cations. (A) For multiple experiments, the plots of change in fluorescence intensity (ΔI/Io) versus divalent ion concentration show higher sensitivity of LB1-TD for divalent cations. Logarithm fits show r2 > 0.9. (B) Plotting of data in A to a Lineweaver-Burk plot (inverse-inverse of plot in A) allows us to extrapolate KD of binding and max binding. The datapoint in the circle was not considered for the fit: this very low ion concentration showed the highest uncertainty, and we did not want to bias the data to this point. For these experiments, n is 2–3 independent experiments starting from transformed E. coli.
