Figure 6.
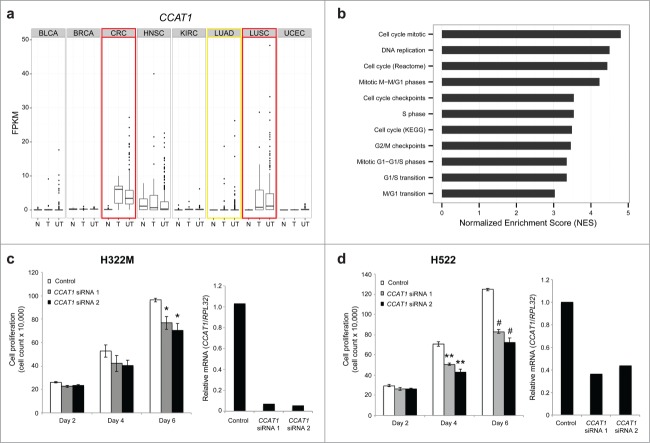
CCAT1 regulates cell growth in lung cancer. (A) Boxplots showing expression levels (FPKM) of CCAT1 for normal samples (N), tumor samples with a matched normal (T), and unpaired tumor samples (UT) across all 8 cancer types. Red boxes highlight up-regulated cancer types and the yellow box highlights the outlier cancer type. (B) GSEA normalized enrichment scores (NES) for cell cycle related gene sets. (C) Cell growth assay in NCI-H322M cells using CCAT1 siRNAs (* P < 0.05 by a 2-tailed Student's t-test) and qPCR validation of CCAT1 siRNA knockdown. (D) Cell growth assay in NCI-H522 cells using CCAT1 siRNAs (** P < 0.01, # P < 0.001 by a 2-tailed Student's t-test) and qPCR validation of CCAT1 siRNA knockdown. All error bars are mean ± standard error of the mean across n = 3 biological replicates.

