Figure 7.

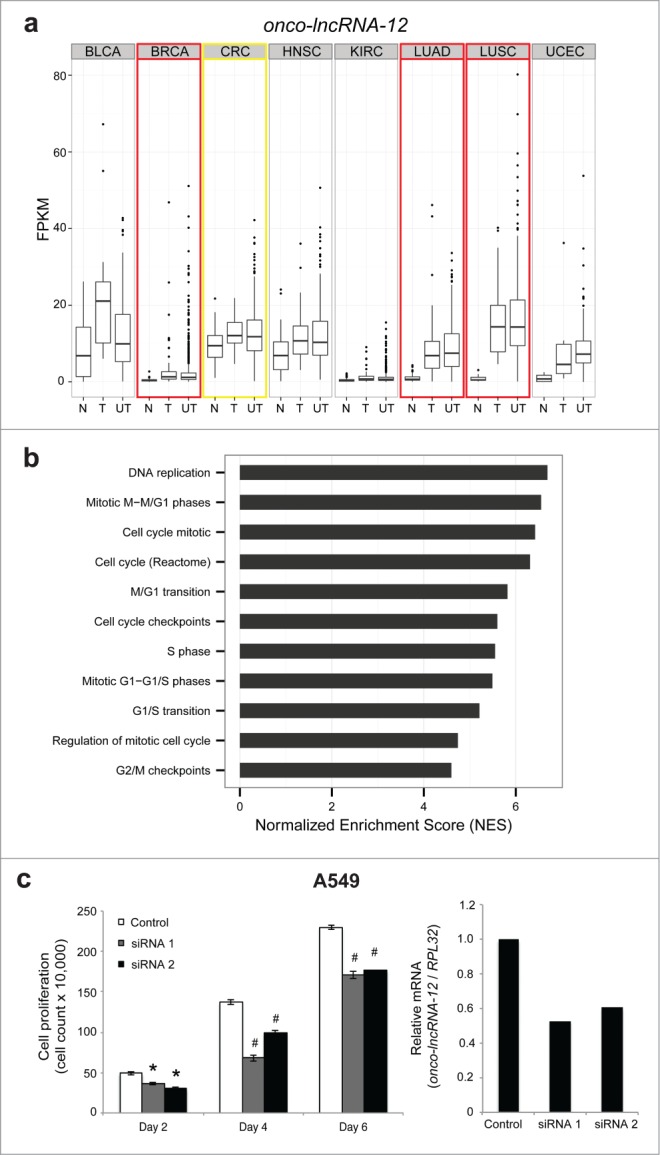
Onco-lncRNA-12 regulates cell growth. (A) Boxplots showing expression levels (FPKM) of onco-lncRNA-12 for normal samples (N), tumor samples with a matched normal (T), and unpaired tumor samples (UT) across all 8 cancer types. Red boxes highlight upregulated cancer types and the yellow box highlights the outlier cancer type. (B) GSEA normalized enrichment scores (NES) for cell cycle related gene sets. (C) Cell growth assay in A549 cells using onco-lncRNA-12 siRNAs (* P < 0.01, # P < 0.005 by a 2-tailed Student's t-test) and qPCR validation of onco-lncRNA-12 siRNA knockdown. All error bars are mean ± standard error of the mean across n = 3 biological replicates.
