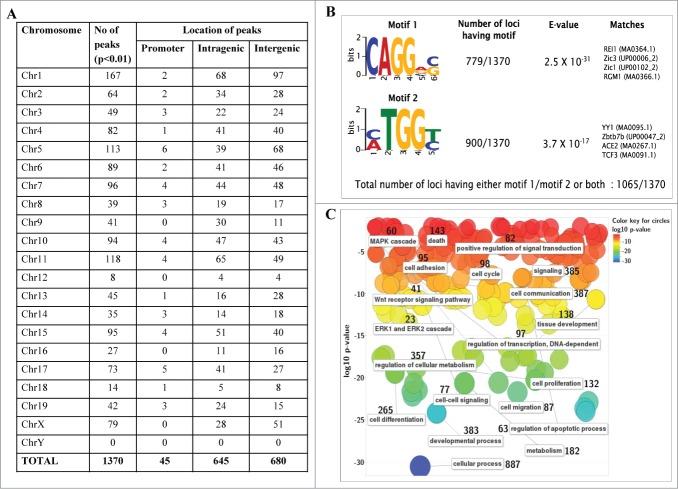
Figure 3.
Genomic topological distribution of mrhl RNA ChOP sequence reads and gene ontology analysis. (A) The 1370 sequence reads were classified on the basis of their position in the mouse genome with respect to a particular gene as follows 1) Promoter reads (upto 1.5 kb upstream of a gene) 2) Intragenic reads (within the body of the gene) 3) Intergenic reads (1.5 kb–2.5 Mb Upstream or downstream to a particular gene). (B) Motif analysis of mrhl RNA bound ChOP sequences. Two enriched motifs were identified by the DREME software relative to random sequence control. E value measures the significance threshold for motifs. E < 0.05 indicates statistical significance. Both the motifs show very high statistical significance. (C) Gene Ontology (GO) analysis of the genes associated with the ChOP sequence reads using the REViGO software. Data is represented as a 2D-scatterplot of biological process. Circles are color coded based on GO p-value. The number besides each functional term denotes the number of genes involved in that particular function (pathway).

