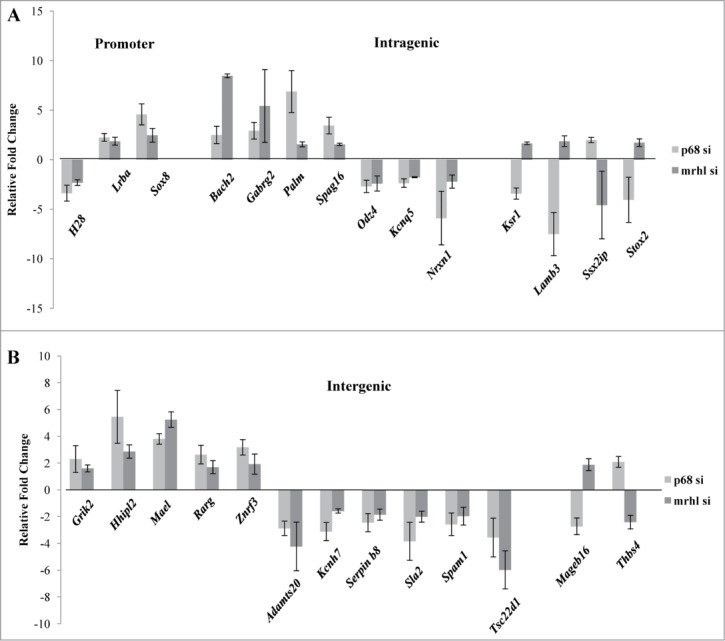
Figure 7.

Expression analysis of the GRPAM genes upon silencing of p68 and its comparison with expression levels observed upon down regulation of mrhl RNA (data taken from microarray data GSE 19355). (A) Expression analysis of promoter and intragenic class of GRPAM genes (B) Expression analysis of intergenic class of GRPAM genes. Each data point in 7A and 7B is an average of 4 independent biological replicates and the error bar represents standard deviation.
