Figure 6.

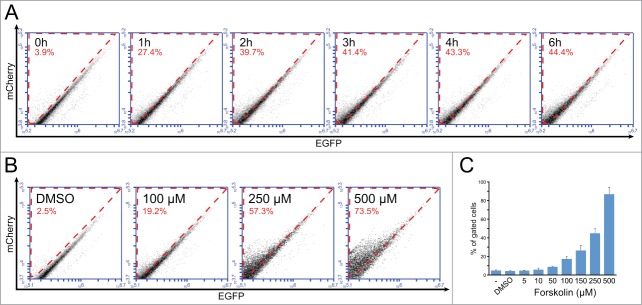
Visualization of RNA editing in Caco-2 cells after induction with Forskolin. (A) Increase of RNA editing in Caco-2 after induction with Forskolin. Cells transduced with an mCherry-ApoB-EGFP lentiviral construct were induced for the indicated times with 250 μM Forskolin. (B) Titration of RNA editing in cells transduced with an mCherry-ApoB-EGFP lentiviral construct after a 6 h treatment with Forskolin at the indicated concentrations. (C) The chart shows the percentage of gated cells in cells untreated, treated with Forskolin at the indicated concentrations or with DMSO alone (same amount as the highest concentration of Forskolin). The error bar indicates the SEM from 4 experiments.
