
Figure 6.
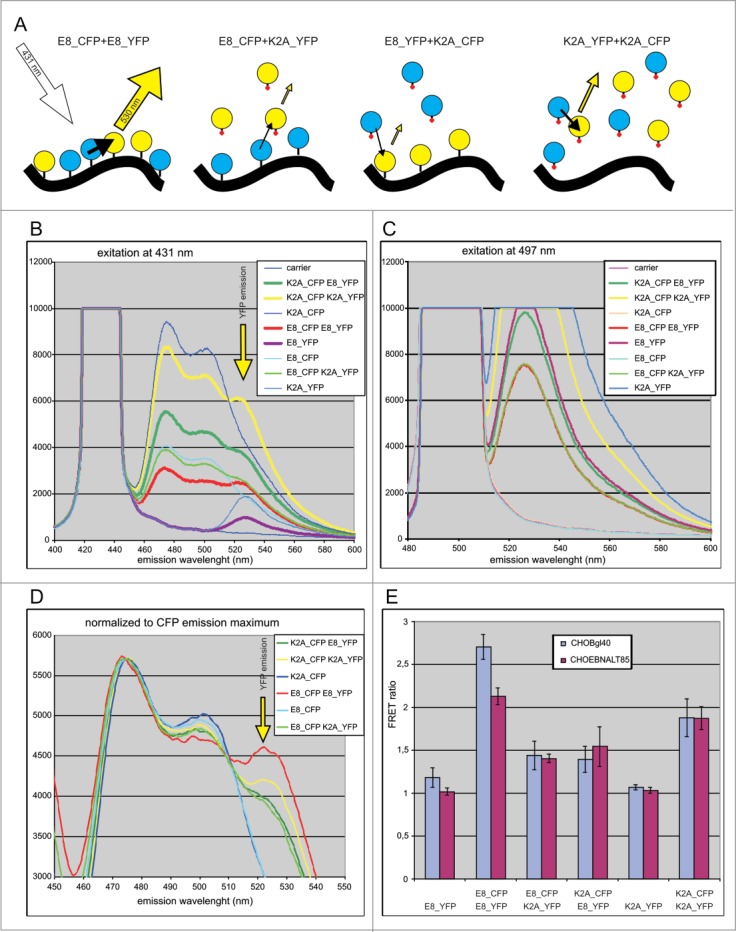
Examination of the colocalisation of E8 and its mutant in vivo in undisturbed cells by FRET analysis. (A) Schema for the FRET assay. Emission from different combinations of proteins when excited at the CFP-specific wavelength (431 nm). Yellow arrows correspond to emission at the YFP-specific wavelength (530 nm), and black arrows indicate FRET. The size of the arrows corresponds to emission or FRET intensity. Circles in cyan or yellow correspond to CFP and YFP, respectively. The tittle on each circle is the wild-type E8 peptide, and the tittle with a red dot is the mutant K2A. The black solid line represents the NM. (B) Emission spectra of the cell suspension when excited at the CFP-specific wavelength (431 nm). (C) Emission spectra of the cell suspension when excited at the YFP-specific wavelength (497 nm). (D) Emission spectra when excited at the CFP-specific wavelength and normalized to the CFP emission maximum (475 nm). (E) The FRET ratio shows how the YFP emission differs in the presence of CFP compared to YFP alone when excited at the CFP-specific wavelength in CHOBgl40 and CHOEBNALT85 cell lines.