Figure 1.
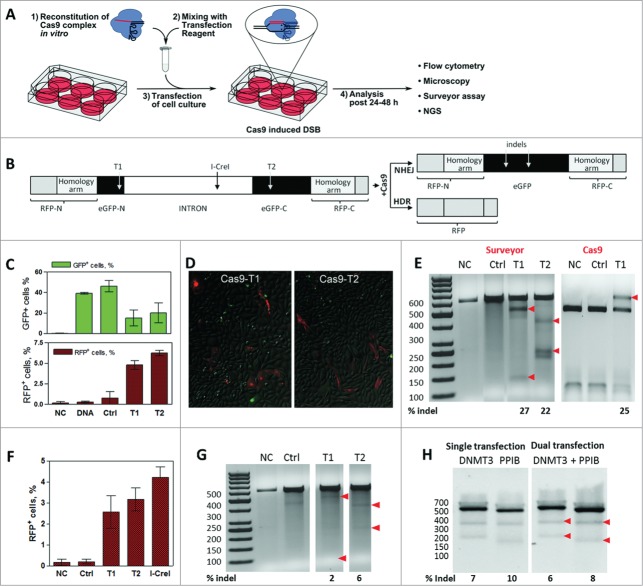
Gene editing by in vitro reconstituted S. thermophilus Cas9-crRNA-tracrRNA complex. (A) Workflow of the cell transfection experiment: 1) In vitro reconstitution of the Cas9-crRNA-tracrRNA complex; 2) Transfection mix preparation; 3) Transfection of cells; 4) Analysis of Cas9-mediated genome modification 24–48 h post transfection. (B) CMV-promoter driven dual reporter gene cassette for the Cas9 cleavage analysis and expected NHEJ or HDR repair products. T1 and T2 designate 2 different Cas9 target sites. Insertion of the reporter gene cassette into a plasmid vector generates a reporter plasmid while insertion into the CHO-K1 cell genome generates a stable reporter cell line. (C) Percentage of GFP+ and RFP+ cells (in T1 and T2-targeted samples) estimated by a flow cytometry. (D) Detection of RFP+ cells (in T1 and T2-targeted samples) using fluorescent microscope imaging. E) Cleavage analysis of the reporter plasmid. Regions surrounding Cas9 target sites in the reporter plasmid were PCR amplified and reannealed PCR amplicons (592 bp) were digested with Surveyor nuclease or T1 targeting Cas9 complex. Red arrows indicate 100+492 bp and 363+229 bp hydrolysis products for T1 and T2, respectively, and undigested 592 bp fragment. Numbers below indicate indel % calculated by densitometric analysis of corresponding bands. (F) FACS analysis of RFP+ cells in the reporter CHO-K1 cell line transfected by Cas9 or I-CreI nucleases. (G) Cleavage of the chromosomal Cas9 target sites in the CHO-K1 cell line. Regions surrounding chromosomal Cas9 target sites were PCR amplified and reannealed PCR amplicons (592 bp) were digested with Surveyor nuclease to produce 100+492 bp fragments (T1) and 363+229 bp fragments (T2), respectively. Arrowheads indicate nuclease digestion products, numbers below indicate indel % calculated by densitometric analysis of corresponding bands. (H) HEK293T cells were transfected with Cas9 complexes specific for DNMT3B and/or PPIB gene loci. Surveyor digestion was performed on reannealed PCR amplicons - 544 bp (DNMT3B) or 505 bp (PPIB) yielding hydrolysis products of 335+209 bp or 330+174 bp, respectively (red arrowheads). Calculated indel percentages indicate each gene modification extent from single or dual transfection experiments (C and F graphs shows mean values ± SD, n = 3).

