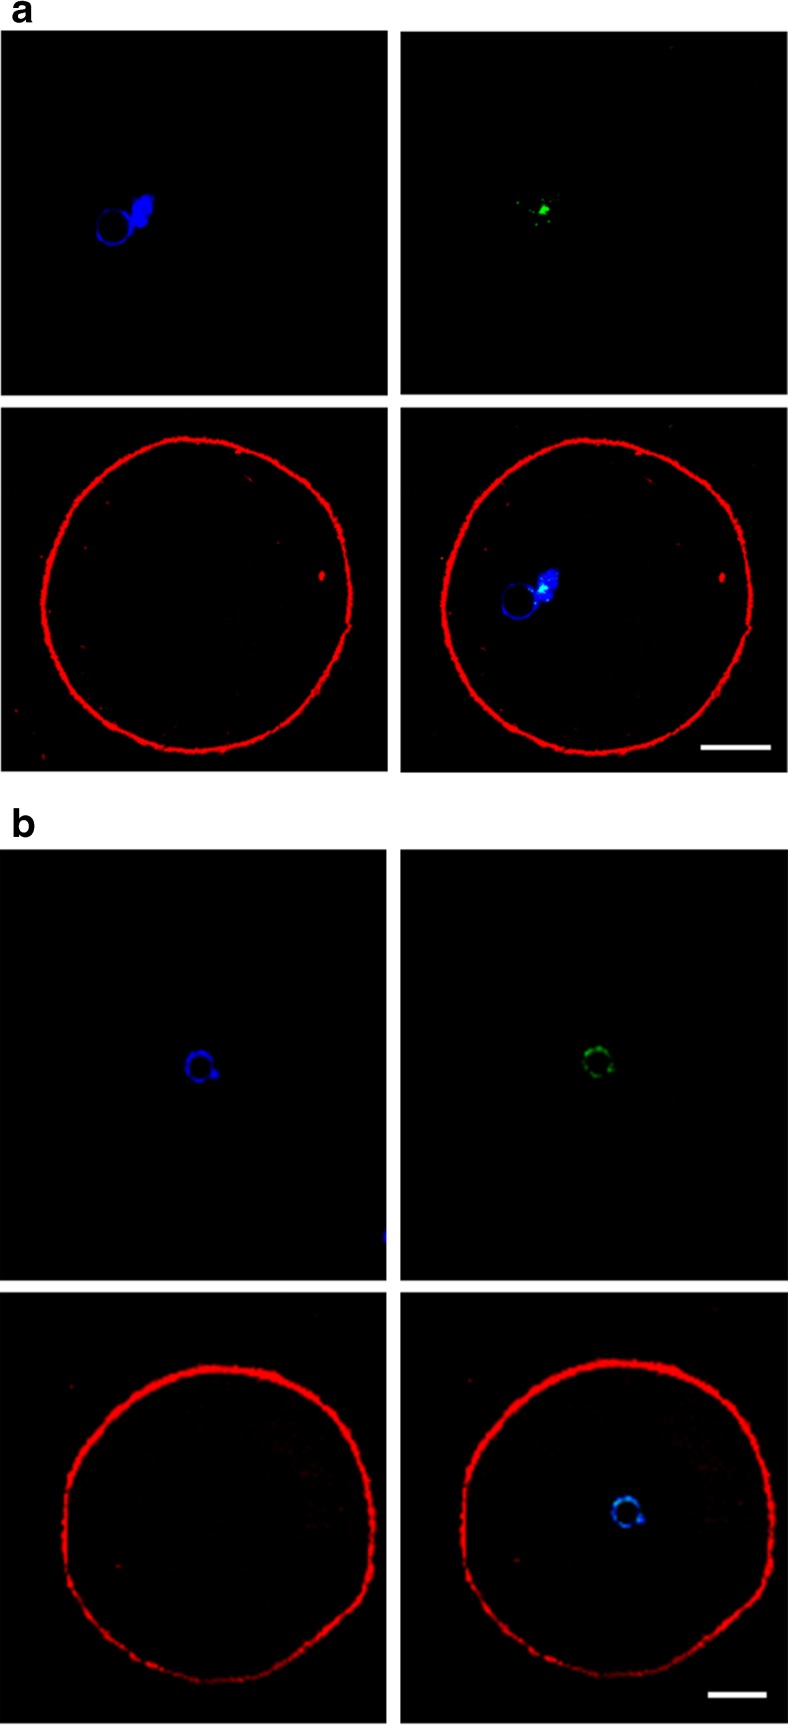
Fig. 1.
Representative images of GV-stage oocytes displaying a single site (a) or multiple sites (b) of DNA damage. Oocytes were stained for chromatin (blue, top left), γH2AX (green, top right) and actin (red, bottom left). Merged images (bottom right) show co-localisation of γH2AX with chromatin. Scale bar equals 15 μm

