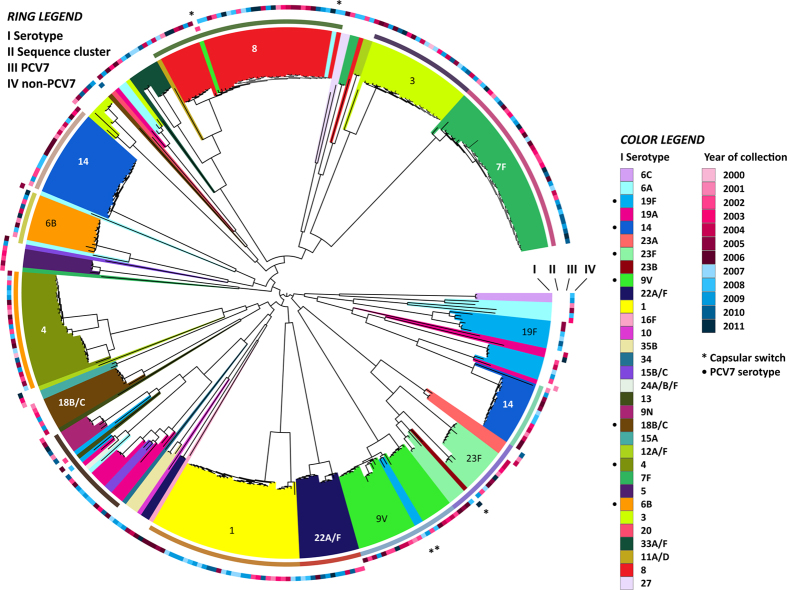
Figure 1. Structure of the invasive pneumococcal population.
The maximum likelihood phylogeny was generated using 59,682 polymorphic sites within a 970,559 bp codon alignment of 755 core OGs with similar phylogenetic profiles as ribosomal protein encoding genes in order to exclude genes that were acquired by, for example, horizontal gene transfer. The inner bars each represent a pneumococcal strain (I) and are colored by capsular serotype. The second circle displays the sequence clusters (II). The year of collection is marked by the color (red: pre-PCV7, blue: post-PCV7) and intensity of coloration per year, for PCV7 vaccine serotypes (III) and non-vaccine serotypes (IV).

