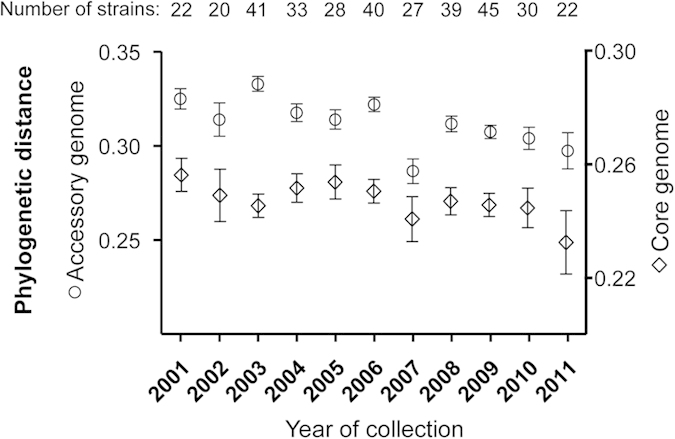
Figure 2. Annual diversity among accessory genomes.

The diversity was calculated between strains collected within the same year. Using a binary measure of the presence (1) or absence (0) of a gene in each accessory OG, diversity among strains was calculated by applying the distance measure described by Dutilh et al.47. Core OG diversity was determined by comparing the pairwise distances between isolates from the phylogenetic tree per year. Circles: means accessory distance; diamonds: means core OG distance; whiskers: 95% confidence intervals.
