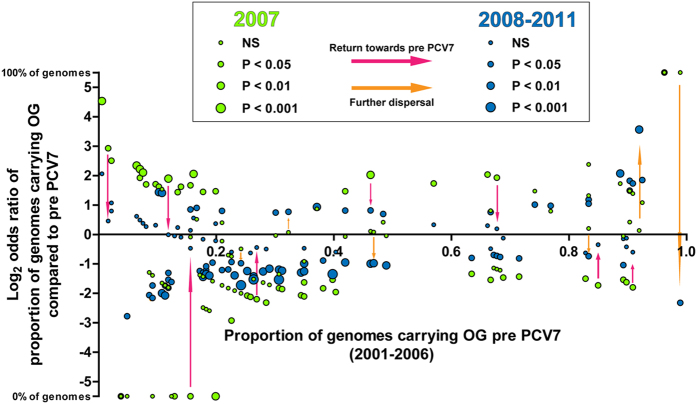
Figure 3. Temporal stability of accessory gene pool.
Odds ratios for prevalence of individual OGs in the accessory genome whose frequency significantly altered at bottleneck shortly post PCV7 (2007) or during re-expansion (2008–2011), compared to pre PCV7 (2001–2006) The X-axis indicates the proportion of isolates carrying each OG in 2001 while the Y-axis indicates the log transformed odds ratio of strains carrying each OG in 2007 (green dots), and post PCV7 (blue dots), relative to pre PCV7.

