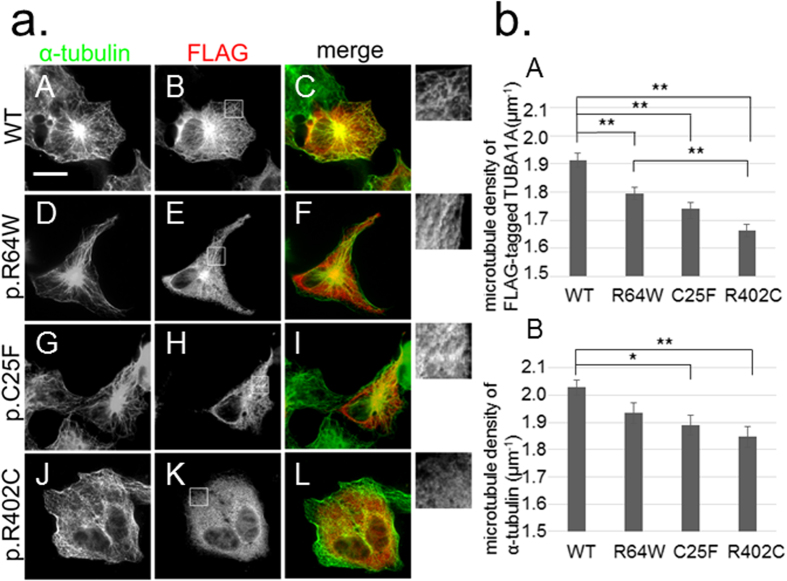
Figure 3. The ability to incorporate into the microtubule network varies among TUBA1A wild-type and mutants.
(a) Transfected COS7 cells were examined by immunofluorescence using an anti-FLAG antibody (red) and an anti–α-tubulin antibody (green). C-terminal FLAG-tagged wild-type TUBA1A was visualised as lines (B) and colocalised with the cytoskeleton of α-tubulin (C). In the case of FLAG-tagged mutant TUBA1A, there were fewer lines than with the wild-type (E,H,K). Insets are magnified images of the boxes. Scale bar, 20 μm. (b) Quantification of microtubule density. We extracted linear staining of FLAG-tagged TUBA1A (A) and the overall cytoskeleton network of α-tubulin (B) of each cell by using the ImageJ KBI Line Extract plug-in and calculated the line density of each cell. Bars represent the means ± SEM (32 cells from wild-type, 28 cells from R64W, 28 cells from C25F, and 31 cells from R402C). Asterisks indicate statistically significant differences (one-way ANOVA and Tukey’s post-hoc test; *p < 0.05, **p < 0.01). (A) The microtubule density of FLAG-tagged mutant TUBA1A was significantly lower than that of FLAG-tagged wild-type TUBA1A. The microtubule density of R64W was the highest among the mutants and that of R402C was the lowest. (B) The microtubule density level of α-tubulin followed the same order as that of FLAG-tagged TUBA1A.

