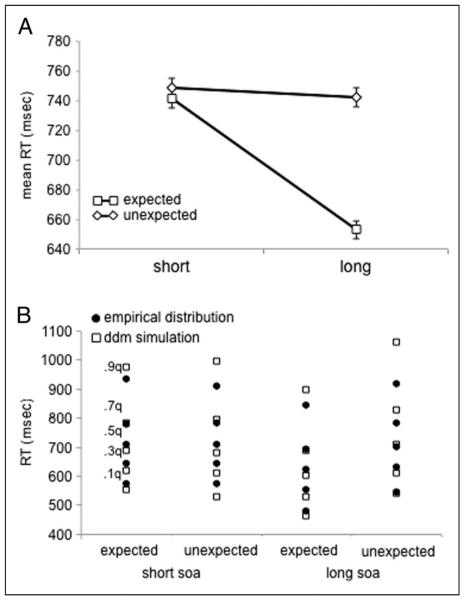
Figure 2.
Behavioral and model simulation results from the LDT. (A) Expected and Unexpected conditions showed an interaction with SOA on RT such that participants were speeded for Expected conditions at the Long SOA. Error bars depict within subject standard error. (B) Five RT quantiles (.1, .3., .5, .7, .9) from the empirical RT distributions are plotted for the Expectation and SOA conditions (solid circles). Simulated RTs from the best fitting DDM model are plotted (open squares) for comparison. This model allowed drift rate and non-decision time to vary as a function of experimental condition. One thousand trials were simulated for each condition.

