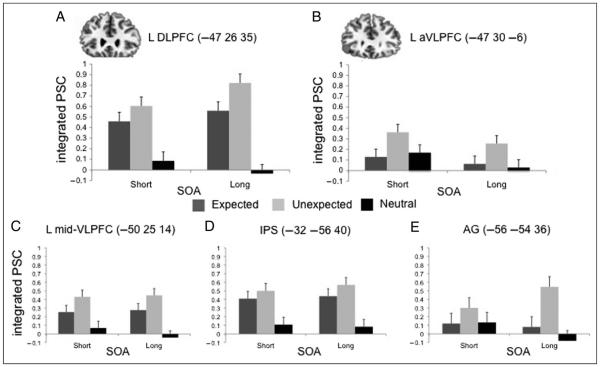
Figure 6.
Plots of percent signal change in ROIs in prefrontal and parietal cortex. Bar plots depict percent signal change integrated over a 4- to 10-sec window following presentation of the prime stimulus. Plots depict Expected (dark gray), Unexpected (light gray), and Neutral (black) across SOA conditions. Results from ROIs in (A) DLPFC, (D) mid-VLPFC, and (C) IPS show similar patterns of Unexpected greater than Expected, with both Rule conditions greater than Neutral. By contrast, (B) aVLPFC and (E) AG show greater activation for Unexpected than Expected and Neutral. Error bars depict within subject standard error.

