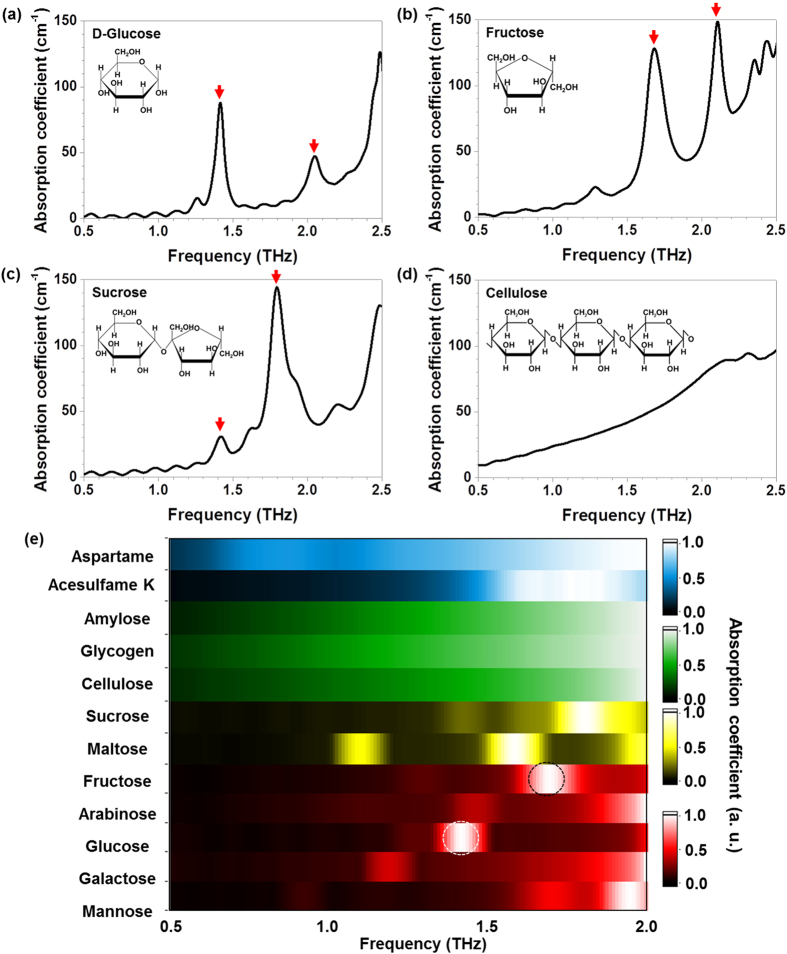
Figure 1. Absorption coefficients for various sugars and sweeteners extracted from THz transmittance measurement.
Absorption coefficients at THz frequencies for (a) D-glucose (C6H12O6), (b) fructose (C6H12O6), (c) sucrose (C12H22O11), and (d) cellulose ((C6H10O5)n) pellets. The insets in (a–d) show the structural formulas of each saccharide. Distinguishable absorption features appear at 1.4 THz for D-glucose, 1.7 THz and 2.1 THz for fructose, and 1.4 THz and 1.8 THz for sucrose, as marked by red arrows; however, cellulose has no special spectral features. (e) Colour contour plots of THz fingerprinting for ten different saccharides and two non-saccharide sweeteners. White and black dashed circles denote the specific frequencies of interest.

