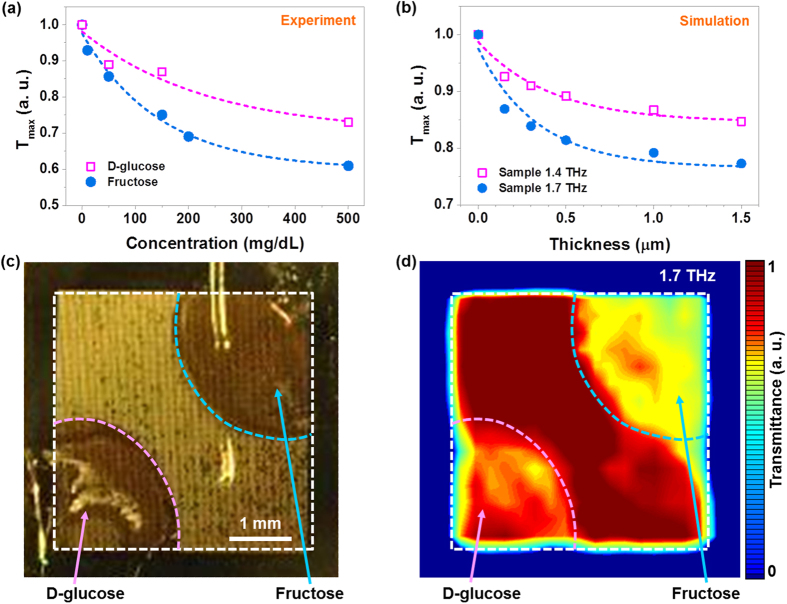
Figure 3. A comparison with THz measurements and FDTD simulations, and THz images obtained with the fructose antenna.
(a) The changes in the maximum values of the normalized transmittances are plotted for fructose and D-glucose as a function of the molecular concentration level, measured using the fructose antenna. (b) Simulation results of cladding thickness-dependent maximum transmittances for two samples having absorption peaks at 1.7 THz and 1.4 THz are shown. The dashed lines are exponential fittings for all cases. (c) A photograph of the nano-antenna with 250 mg/dL of dropped fructose (upper-right corner) and D-glucose (lower-left corner) stains. (d) A normalized THz transmittance image through the fructose antenna with the two samples.

