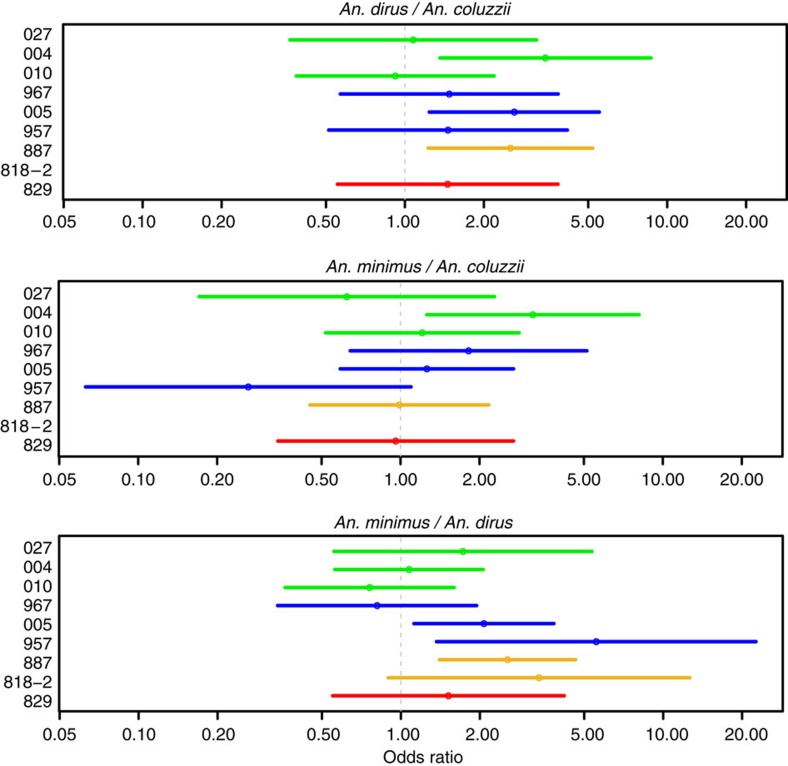
Figure 2. Relative infectivity of P. falciparum clinical isolates to An. dirus, An. minimus and An. coluzzii.
Estimates (points) and 95% confidence intervals (lines) for odds ratios of any oocyst infection, done by a separate logistic regression for each isolate that controls for replicate feeds. The top panel shows the odds for infection of An. dirus over the odds for An. coluzzii, the middle panel shows the odds for An. minimus over the odds for An. coluzzii and the bottom panel shows the odds for An. minimus over the odds for An. dirus. Isolates are colored according to population: KH-C/WT (green), WKH-F02/R539T (blue), WKH-F04/Y493H (yellow) and WKH-F03/C580Y (red).

