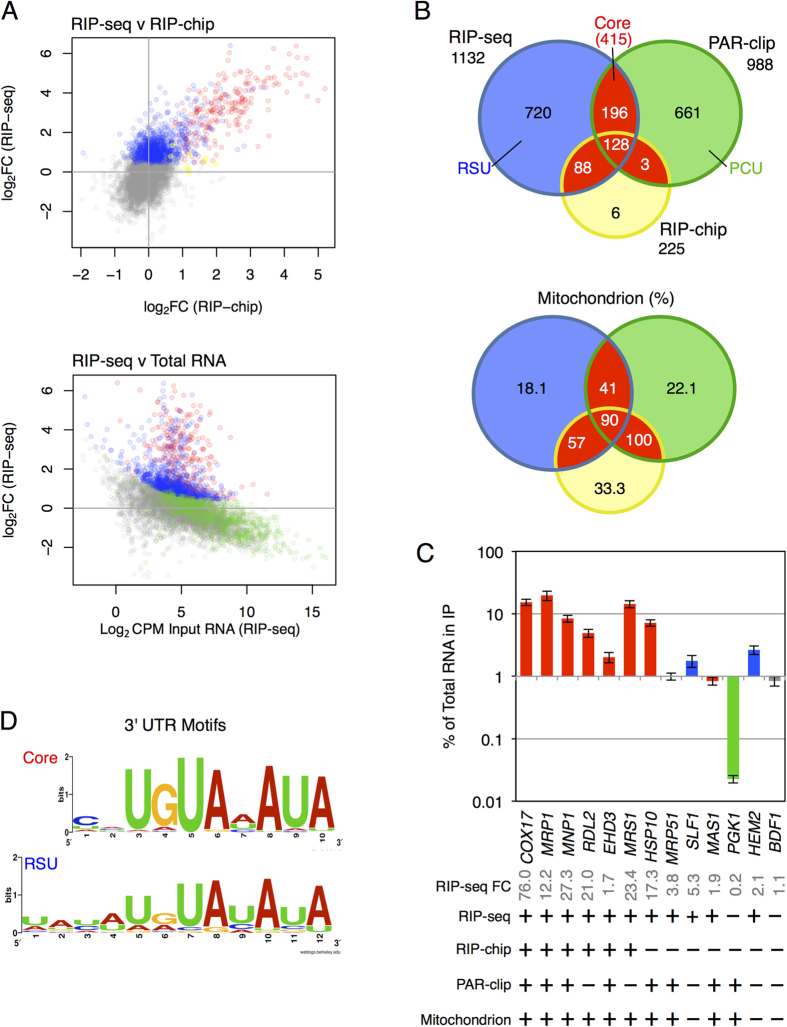
Figure 1. Puf3p RIP Seq identifies novel Puf3p mRNA targets.
(A) Comparison of our RIP-seq data (blue) with the RIP-chip9 (yellow) and PAR-clip23 data (green) identify a common Core set of Puf3p target mRNAs identified in multiple studies (Red), with non-targets colored grey. Top, Scatter-plot comparing the log2 fold enrichments (IP/total) of RIP-seq and previously published RIP-chip data9. Bottom, plot of log2 fold enrichments (IP/total) versus transcript abundance. (B) Venn-style diagrams showing overlaps between our experiment (RIP-seq) and two prior studies. Top chart shows the numbers of RNAs, the lower chart shows the percentage of mitochondrial targets in each sector. Sector colouring follows that used in panel A. (C) 13 mRNAs were quantified using qPCR to confirm our RIP-seq analysis. Data shown are a mean of biological triplicates. Error is Standard error of the mean. Using a digital +/− descriptor where characteristics of each ORF tested is described, ORFs significantly enriched in the Puf3 RIP-seq, PAR-clip and RIP-chip are shown. Mitochondrion GO category presence is also indicated. (D) Logo plots of the motifs found in each 3′ UTR set using MEME. Further details are in Supplementaary Dataset S1.

