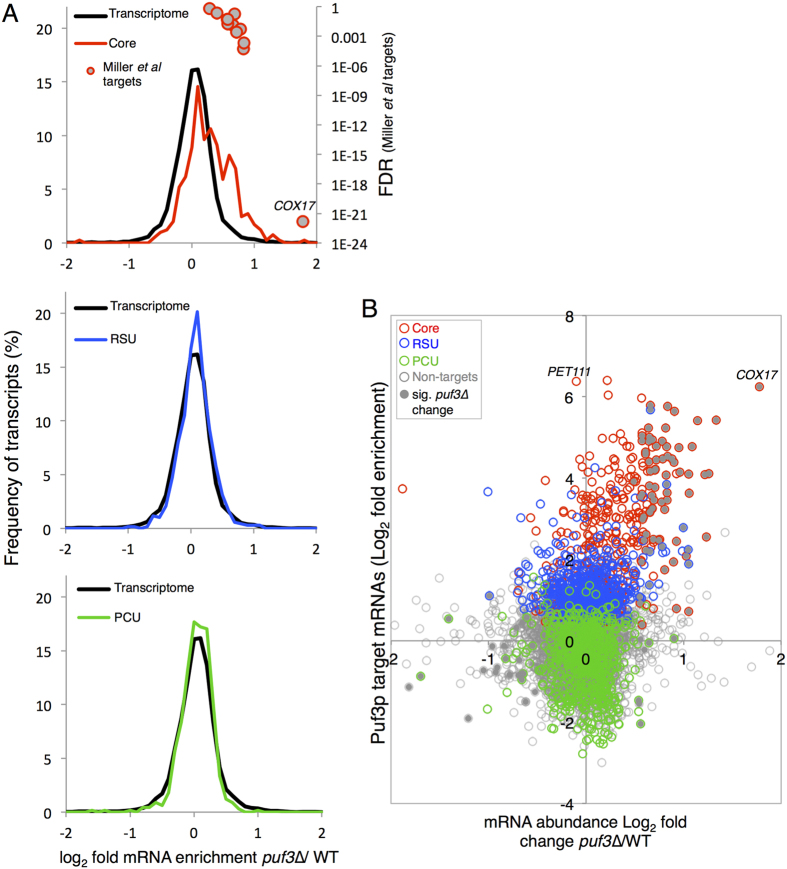
Figure 3. Puf3p affects the abundance of only some of its target mRNAs.
(A) Relative transcript abundance changes Log2 fold enrichment puf3Δ/Wild type. Transcriptome changes were split into ‘bins’ (0.25 fold/bin) and expressed as a percentage of transcripts in each bin for the Core targets (red), RSU (blue) and PCU (green) as defined in Fig. 1A. mRNAs whose stability has been previously shown to be affected by a deletion of PUF320 are all Core targets and are also plotted (red circle, grey filled). (B) A scatterplot comparing the mRNA abundance in the puf3Δ mutant strain and Puf3p mRNA targets identified by RIP Seq. Those that change significantly (FDR < 0.05) have grey filled symbols.

