
Figure 4. Proteomic analysis of puf3Δ and wild-type strains.
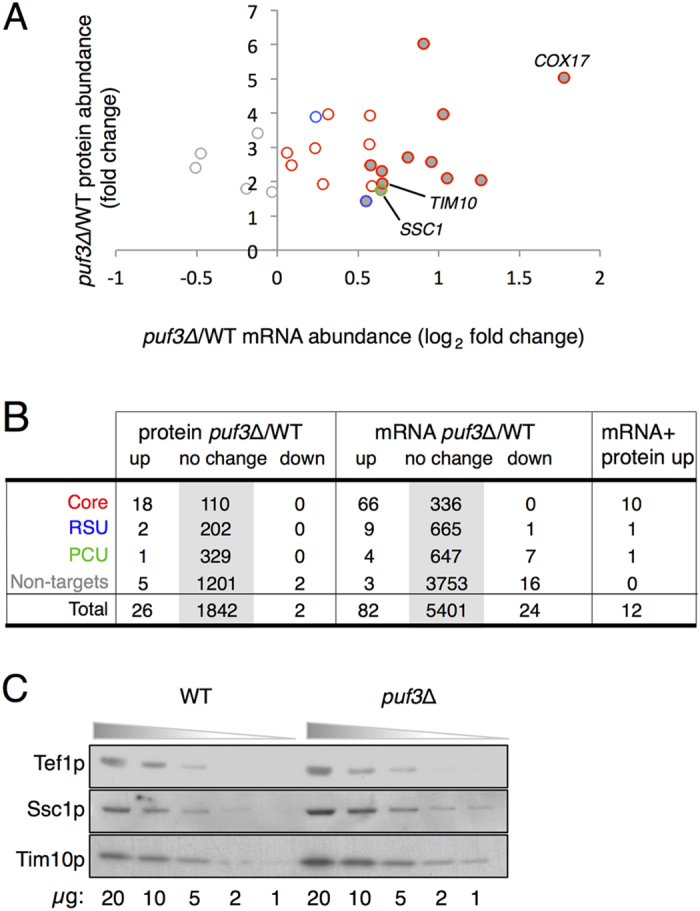
(A) Fold-enrichment for proteins identified as increasing or decreasing in the puf3Δ mutant compared with the wild-type strain (Y-axis) plotted with changes in mRNA abundance from RNA-seq (X-axis). Only proteins found to significantly alter in abundance (FDR < 0.05) are shown. Data points are coloured as per Fig. 1. Proteins whose mRNAs are also altered in abundance are filled grey. (B) Summary table comparing proteome transcriptome and Puf3p interactions. (C) Immunoblotting of Tef1p (a loading control), Tim10p and Ssc1p. The indicated amount of total soluble protein (μg) was loaded from puf3Δ and wild-type strains.