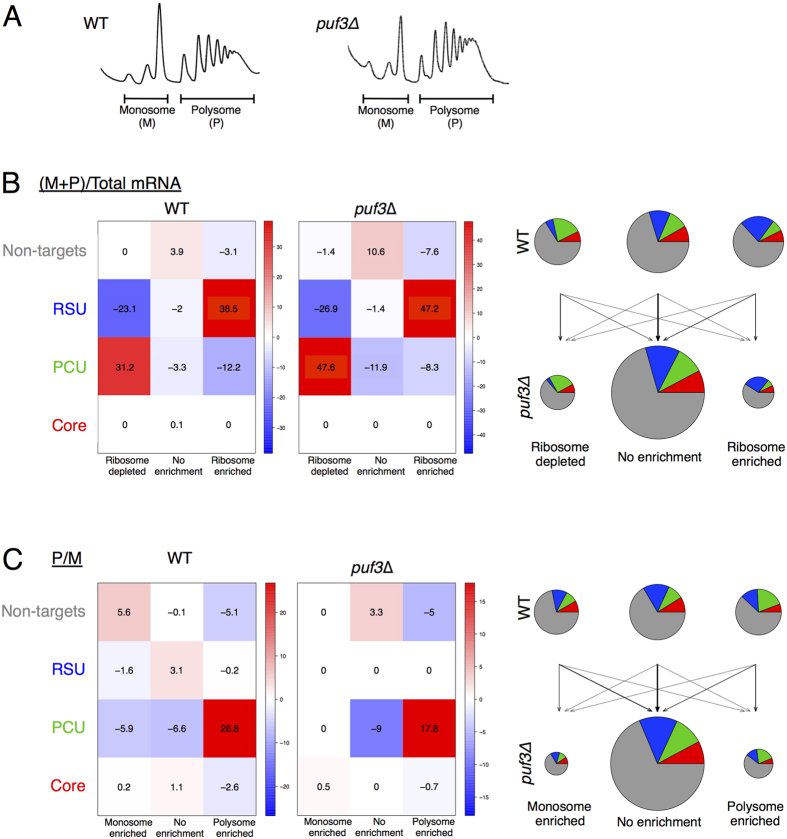
Figure 5. Translatomics comparison of puf3∆ and wild-type strains.
(A) Polysome profiles of extracts from wild-type and puf3∆ cells, performed in triplicate and resolved on 15–50% sucrose gradients. Regions pooled for monosome (M) and polysome (P) RNA-seq are shown. (B) Analysis of the impact of puf3∆ on the engagement of mRNAs in the four indicated groups with ribosomes as determined by determining from RNA sequencing the fraction of each mRNA in monosomes (M) + polysomes (P) versus total mRNA for wild-type (WT) (left) and puf3∆ cells (middle). Each mRNA is designated as enriched, depleted or neither according to the EdgeR analysis (see Supplementary Dataset S1). Statistical enrichments (positive numbers shaded red) or depletions (negative numbers, shaded blue) for each grouping are shown for enrichments where 2 or −2 indicates P = 0.01 and 3 or −3 indicates P = 0.001 etc. The right panels depict the same data as a series of pie charts showing the relative changes in each grouping in the puf3∆ strain. (C) Analysis as per panel B except comparing polysome (P) to monosome (M) ratios in each strain. The full datasets are shown in Supplementary Dataset S1.

