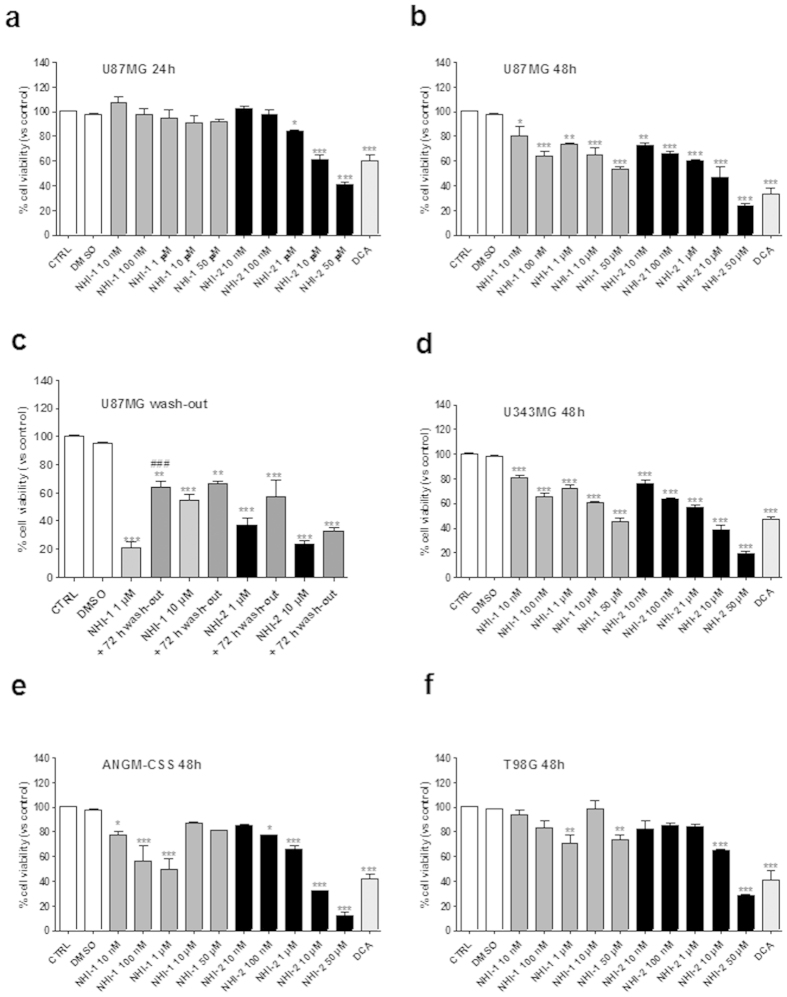
Figure 1. Effects of LDH-A inhibition on GBM cell viability.
U87MG cells were treated in complete medium with the indicated concentrations of NHI-1 or NHI-2 or DCA (100 μM) for 24 h (a), or 48 h (b). (c) U87MG cells were treated with NHI-1 or NHI-2 (1 μM or 10 μM) for 72 h, and subsequently the cells were washed-out for additional 72 h in drug-free medium. U343MG (d), ANGM-CSS (e) or T98G cells (f) were treated in complete medium with the indicated concentrations of NHI-1 or NHI-2 or DCA (100 μM) for 48 h. At the end of the treatments, cell viability was measured using CellTrace dye labelling, as described in the Methods section. The data were expressed as the percent change with respect to untreated cells (control), which was set to 100%, and they are the mean values ± SEM of three independent experiments, each performed in triplicate. The significance of the differences was determined by one-way ANOVA and Bonferroni’s post hoc test: *P ≤ 0.05, **P ≤ 0.01, ***P ≤ 0.001 vs. the control; ###P ≤ 0.001 vs. the cells treated for 72 h.

