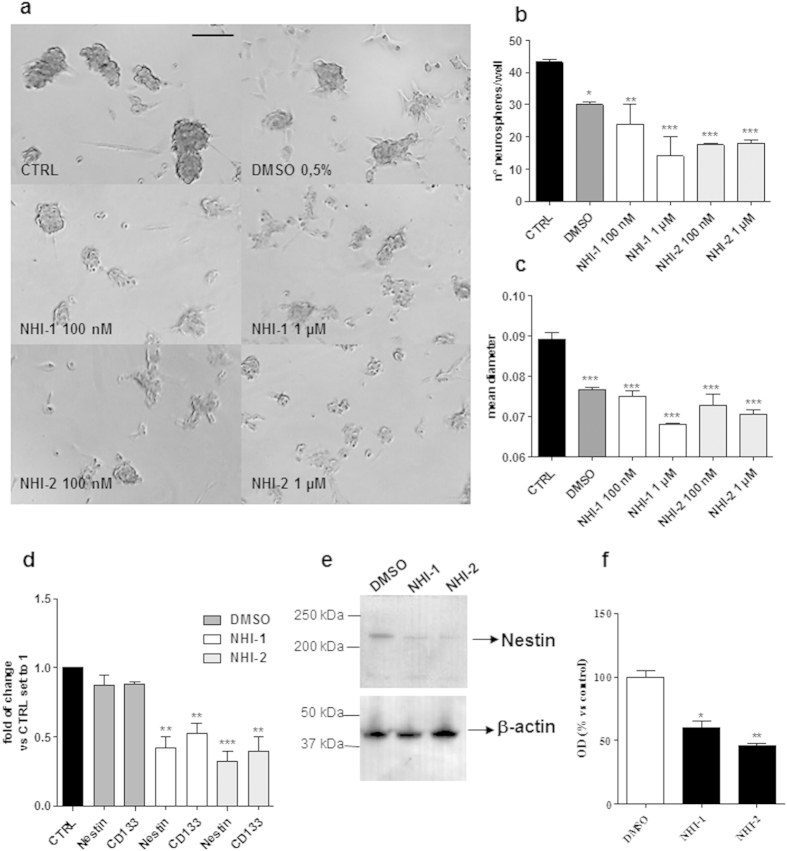
Figure 4. Effect of LDH-A inhibition on the formation of GSCs.
U87MG were incubated with DMSO or the NHI-1 and NHI-2 compounds (100 nM−1 μM) in a defined serum-free NSC medium for 9 days. (a) Representative pictures of the cells after 9 days of incubation were shown. The number of the newly formed spheres (b) and the mean diameter (c) were scored using the ImageJ program. The data represent the means ± SEM of three pictures from two independent experiments. The significance of the differences was determined by one-way ANOVA and Bonferroni’s post hoc test: *P ≤ 0.05, **P ≤ 0.01, ***P ≤ 0.001 vs. the control or DMSO. (d) The cells were treated as in (a) (NHI-1 and NHI-2: 100 nM). Real Time RT-PCR analysis of the stem cell markers (CD133 and Nestin) was performed. (e,f) The cells were treated as in (a) (NHI-1 and NHI-2: 100 nM), and the obtained cell lysates were subjected to Western blotting. (e) Representative Western blots. The full-length blots are reported in the Supplementary Information section titled “Full-length blots of the cropped images shown in the main Figures”. (f) The bar graph shows the results of the quantitative analysis of the Western blots, which was performed using the ImageJ program. The data were expressed as the percent change in the optical density of the immunoreactive bands relative to that of the control, which was set to 100%, and are the mean values ± SEM of three different experiments. The significance of the differences was determined by one-way ANOVA and Bonferroni’s post hoc test: *P < 0.05, **P < 0.01 vs. control.

