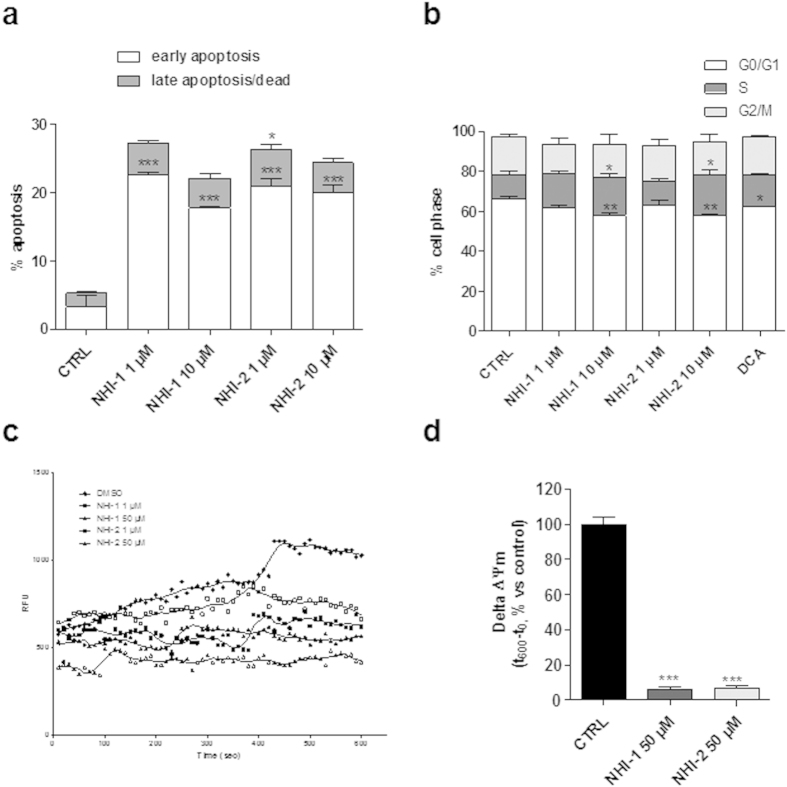
Figure 7. Effect of LDH-A inhibition on the induction of GSC apoptosis, cell cycle block, and Δψm.
(a) GSCs were treated for 7 days with DMSO (control), or NHI-1 or NHI-2 (1 μM−10 μM). At the end of the treatments, the cells were collected and the level of phosphatidylserine externalisation was evaluated using the Annexin V-staining protocol. The data were expressed as the percentage of apoptotic cells versus the total number of cells, and represent the mean ± SEM of three different experiments. (b) GSCs were treated for 7 days with DMSO (control), or NHI-1 or NHI-2 (1 μM−10 μM), or DCA (100 μM) and the cell cycle was analysed. The data were expressed as percentage of cell in the different phases (G0/G1, G2/M or S) versus total cell number, and they are the mean values ± SEM of three different experiments. (c) GSCs were treated with DMSO or NHI-1 or NHI-2 (1 μM−50 μM) for 7 days. At the end of treatments, mitochondria were isolated and the Δψm (for 5 μg of proteins) was evaluated using JC-1 protocol. (c) Representative graph of mitochondria potential evaluation using JC-1 protocol. (d) The data were expressed as the variation of JC1 uptake into mitochondria, calculated as the difference between RFU at the beginning and those read after 10 min, and represent the mean ± SEM of three different experiments, each performed in duplicate. The significance of the differences is determined with a one-way ANOVA with Bonferroni’s post hoc test: *P ≤ 0.05, **P ≤ 0.01, ***P ≤ 0.001 vs. the respective control.

