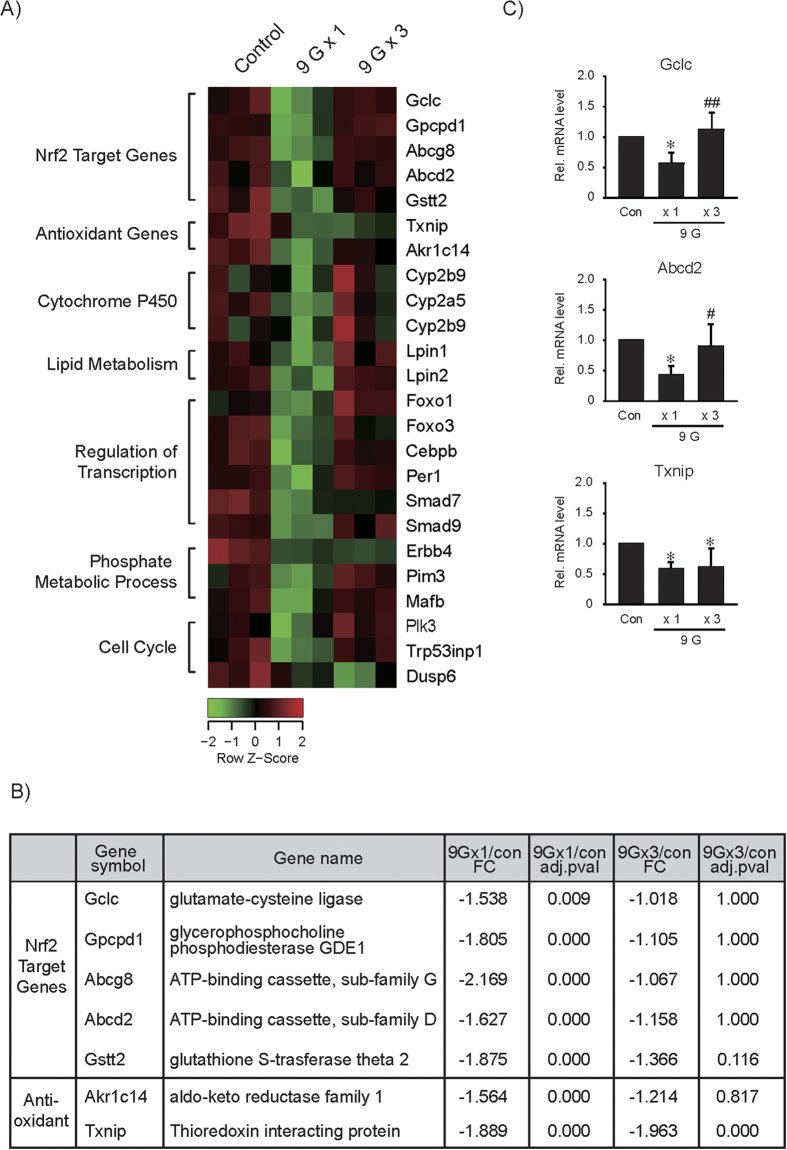
Figure 3. cDNA microarray and qRT-PCR assays.
(A) Heat map. cDNA microarray analyses were done on RNA samples extracted from the liver. Mice were subjected to a single load to +1 Gz (control, Con) or +9 Gz for 1 h, or to three consecutive daily loads, and the liver samples were obtained 6 h after treatment (N = 3 each). (B) Relative changes and significance values for the transcripts of a subset of genes targeted by Nrf2 and two Nrf2-independent antioxidant genes. (C) qRT-PCR assays for Gclc, Abcd2 and Txnip in the liver. Data represent the mean±S.E (N = 4 each). Statistical significance of the differences was determined as compared to control group (*P < 0.05) or to a single load to +9 Gz treatment (#P < 0.05, ##P < 0.01).

