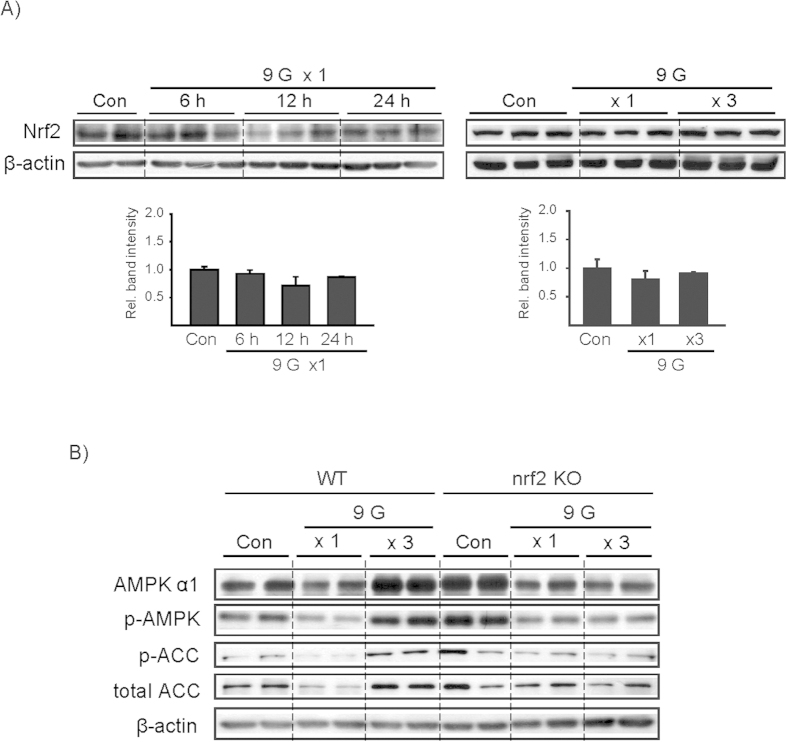
Figure 4. Nrf2 levels after load(s) to +9 Gz and the effect of Nrf2 gene knockout on AMPK.
(A) Immunoblottings for Nrf2 in the liver. Mice were treated as described in the panels to Fig. 2. Of six different samples, two or three representative lanes were shown in each group. Data represent the mean±S.E (N = 6 each). No statistical significance of the differences was found between each treatment group and control. (B) Immunoblottings on the liver samples. C57BL/6 mice (wild type) or Nrf2 gene knockout (KO) mice were treated as described in the panel A to Fig. 3. Of three different samples, two lanes were shown in each group.

