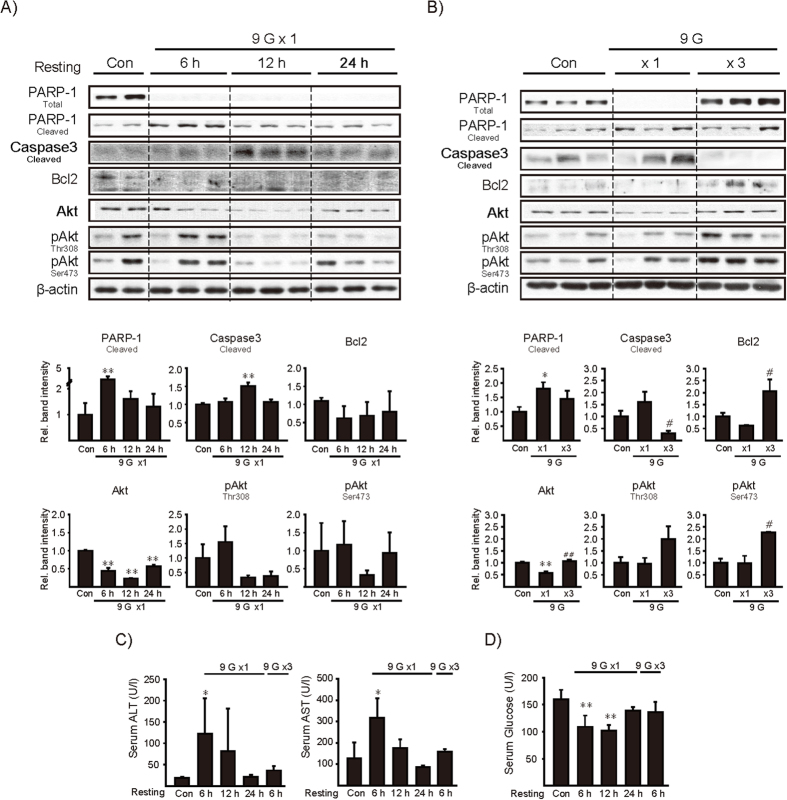
Figure 5. The effects of +9 Gz load(s) on the markers associated with hepatocyte viability or blood glucose contents.
(A,B) Immunoblottings for the molecules associated with apoptosis or cell survival in the liver. Mice were treated as described in the panels to Fig. 2. Of six different samples, two or three representative lanes were shown in each group. (C) Serum transaminase activities. (D) Serum glucose levels. For A-D, data represent the mean±S.E (N = 6 each). Statistical significance of the differences was determined as compared to control group (*P < 0.05, **P < 0.01) or to a single load to +9 Gz (#P < 0.05, ##P < 0.01).

