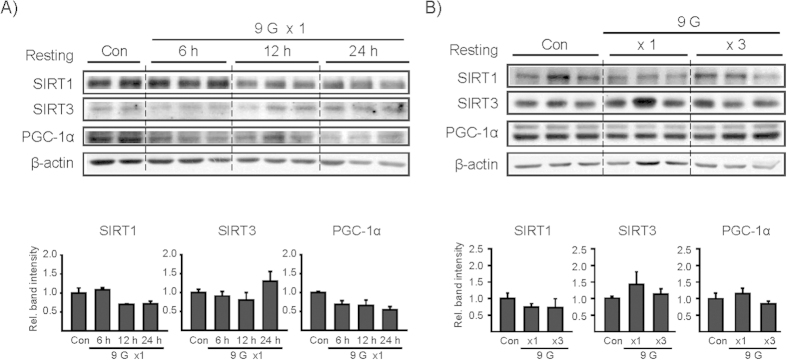
Figure 7. The effects of +9 Gz load(s) on SIRT and PGC-1α levels.

(A,B) Immunoblottings for SIRT1, SIRT3, and PGC-1α. Mice were treated as described in the panels to Fig. 2. Of six different samples, two or three representative lanes were shown in each group. Data represent the mean±S.E (N = 6 each). No statistical significance of the differences was found between each treatment group and control. Con, control.
