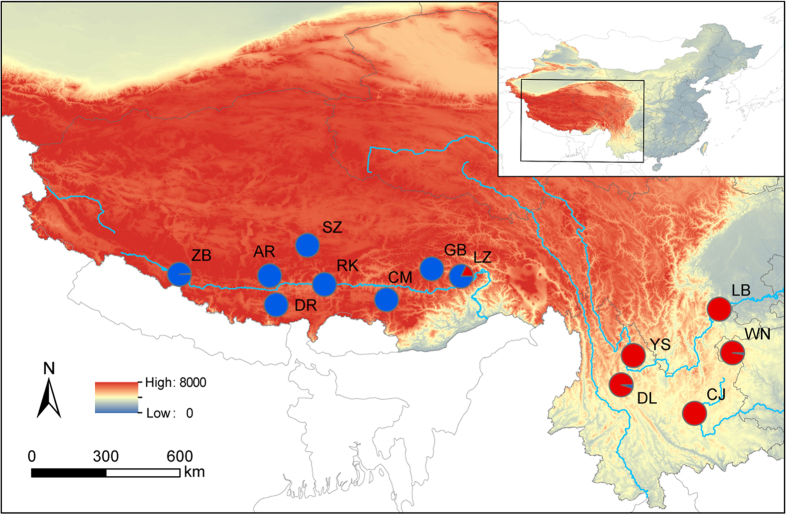
Figure 1. Thirteen sampling sites of Myriophyllum spicatum in the QTP and adjacent highlands mapped using ArcGIS.
Pie charts represent the probability of assignment to subclusters when K = 2, as identified by STRUCTURE based on microsatellite data. Population codes are shown on the side. The elevation range and main rivers are visualized.

