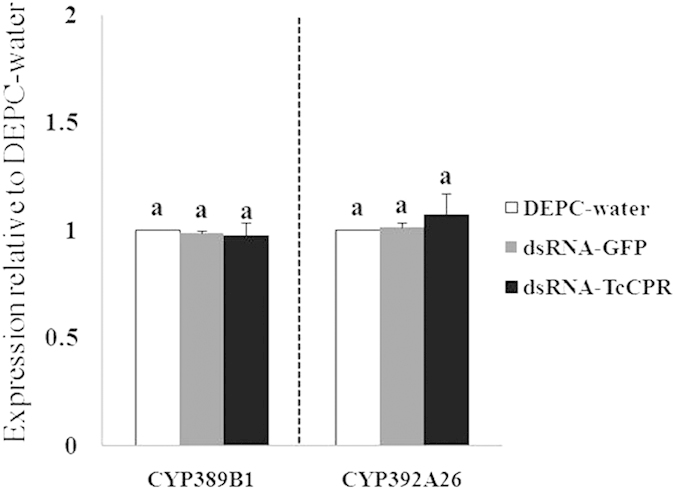
Figure 6. Quantitative PCR expression analysis of two P450 genes after dsRNA-TcCPR feeding.

Error bars represent the standard error of the calculated mean based on three biological replicates. Different letters on the error bars show significant difference according to Duncan’s multiple tests (P < 0.05). i.e. No statistical difference between “a” and “a”.
