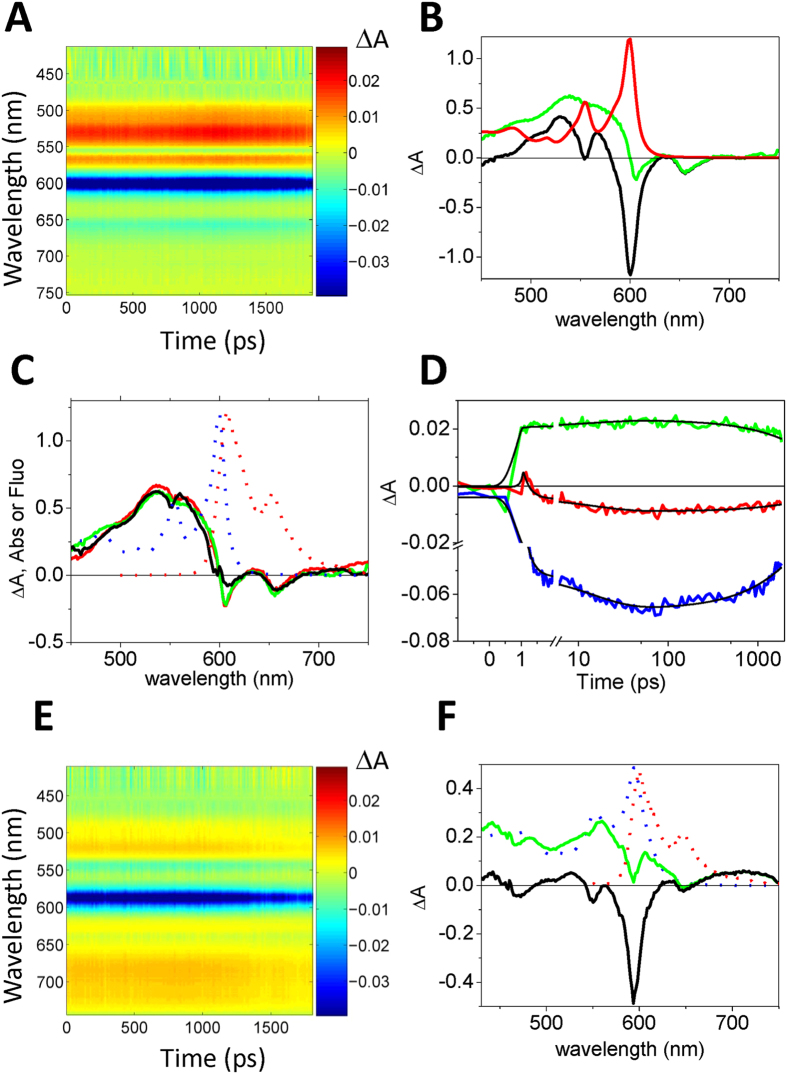
Figure 1. Detection of stimulated emission in femtosecond pump-and-probe experiments.
(A) Transient absorption time/wavelength plot after femtosecond excitation at 400 nm for Hyp (120 μM) in DMSO. (B) The steady state absorption spectrum (red solid line) is used to remove the ground state bleaching from the raw transient absorption spectra (black line). This allows to retrieve corrected transient absorption spectra (green line). The example corresponds to the transient spectrum at 100 ps delay. (C) Corrected transient absorption spectra for Hyp (120 μM) in DMSO at 3 ps (black), 10 ps (red), and 100 ps (green). The dotted lines correspond to steady state absorption (blue) and fluorescence emission (red). (D) Absorption changes after 400 nm excitation of Hyp (120 μM) in DMSO at selected wavelengths, reflecting excited state absorption (521 nm, green), ground state bleaching (592 nm, blue), and stimulated emission (647 nm, red). Black solid lines are the result of a global analysis performed on the single traces using a sum of three exponential decay functions. (E) Transient absorption time/wavelength plot after femtosecond excitation at 400 nm for Hyp-apoMb (120 μM Hyp, 530 μM apoMb) in PBS. (F) The steady state absorption spectrum (blue dotted line) is used to remove from the raw transient absorption spectra (black line) the ground state bleaching. This allows to retrieve corrected transient absorption spectra (green line). The sample curves corresponds to a 1000 ps delay. The dotted red line corresponds to steady state fluorescence emission.

