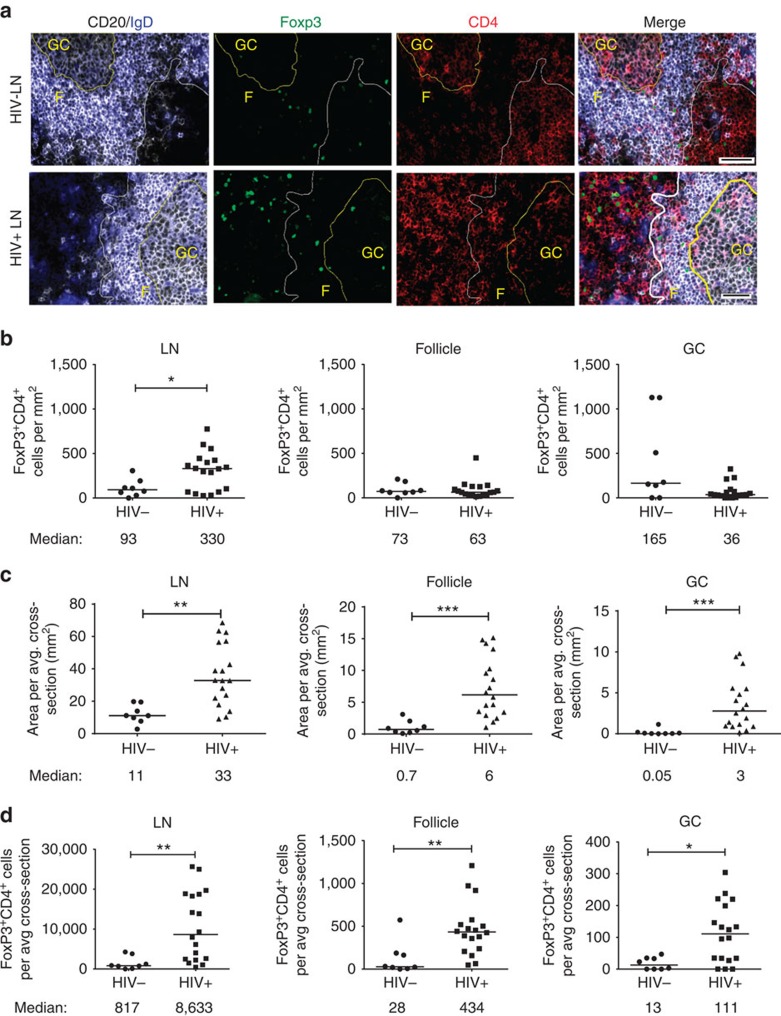
Figure 1. TFR expansion in human lymph nodes (LNs) during HIV infection.
(a) Representative images of immunofluorescently stained LN sections from a subject with chronic, untreated HIV infection (n=17) and an uninfected control subject (n=8). LNs were stained with fluorescently labelled antibodies to CD20 (white), IgD (blue), Foxp3 (green) and CD4 (red). Follicle (F) was defined as CD20+ (white line) and germinal centre (GC) was defined as CD20+IgD− (yellow line). Images were scanned at × 60 magnification and scale bars equal 20 μm. (b) Foxp3+CD4+ cells were quantified in different regions of immunofluorescently stained LN shown in a from uninfected (n=8) and HIV-infected (n=17) subjects using visual inspection and quantitative image analysis to determine areas. (c) The average areas of total (LN), follicular and GC regions per LN cross-section were determined by quantitative image analysis. (d) The average number of CD4+Foxp3+ cells per LN, F and GC cross-section was calculated by multiplying the frequency of CD4+Foxp3+ cells per mm2 (b) by the average area of each region (c) for each subject. The horizontal bars of each graph indicate the median value and are listed where appropriate for clarity. Statistical analyses were performed by Mann–Whitney (Wilcoxon) tests to compare unpaired, nonparametric values and significance is denoted by asterisks where *P<0.05 and **P<0.01.

