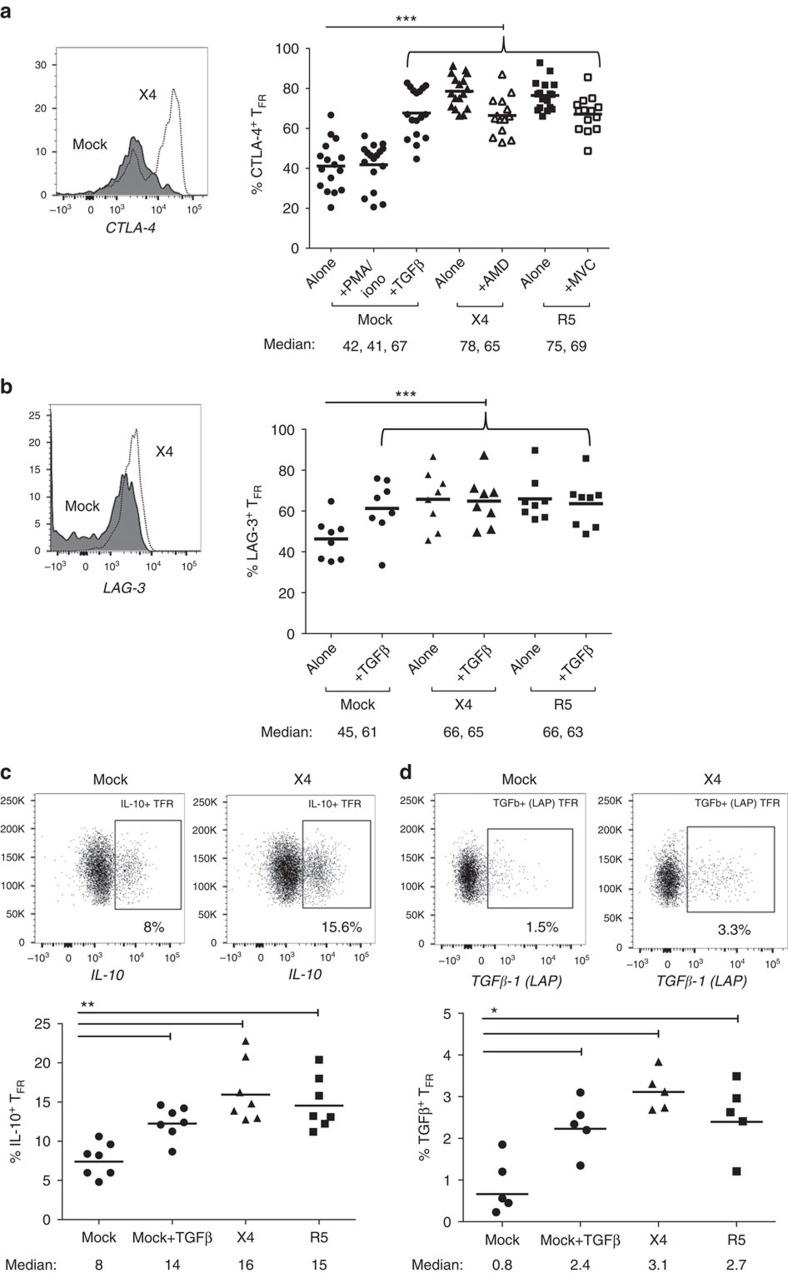
Figure 6. TFR exhibit an enhanced regulatory phenotype in ex vivo HIV infection.
Tonsil cells were mock-, X4-, or R5-spinoculated and cultured under experimental conditions as indicated. TFR were then analysed for expression of regulatory receptors and cytokine production by intracellular cytokine staining. (a) Percentage of total (surface and intracellular) TFR CTLA-4 expression (n=15). (b) Percentage of surface TFR LAG-3 expression (n=8). (c) Production of IL-10 by TFR (n=7). (d) Production of TGF-β-1 (measured as LAP) by TFR (n=5). The horizontal bars of each graph indicate the median value and are listed where appropriate for clarity. Statistical analyses were performed by Friedman (a,b) or Mann–Whitney tests (c,d) and significance is denoted by asterisks where *P<0.05, **P<0.01 and ***P<0.001.

