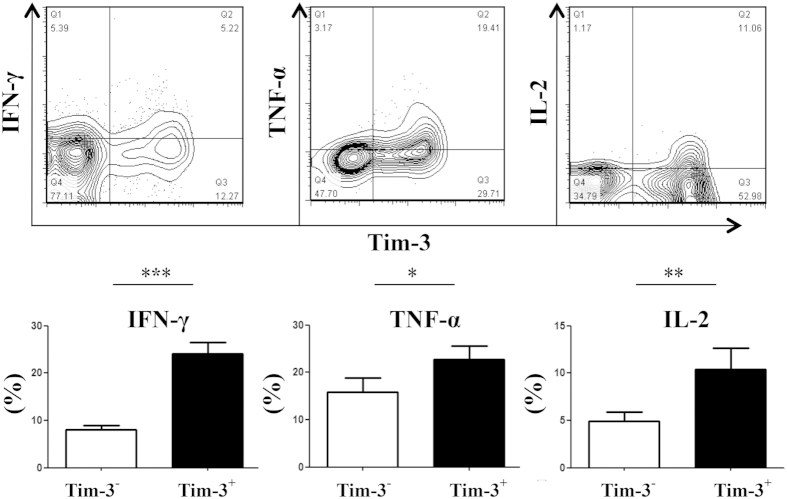
Figure 4. More effector cytokine secretion by TIM-3+ compared to TIM-3- population of tumor infiltrating CD8+ T cells in mouse CT26 colon tumor model.
CT26 tumor cells were inoculated in BALB/c mice and were allowed to form solid tumor. The TIM-3+ population of tumor-infiltrating CD8+ T cells produces higher level of IFN-γ, TNF-α and IL-2 compared to that by the TIM-3- population on day 28- post tumor inoculation. Dot-plots demonstrate cytokine frequencies of TIM-3+ and TIM-3- populations of a single mouse representing each experimental group. Data are mean ± SD of at least 3 similar experiments (n = 6; *** = p < 0.0001; ** = p < 0.001; * = p < 0.01; p values for Mann-Whitney U test).

