
Figure 5.
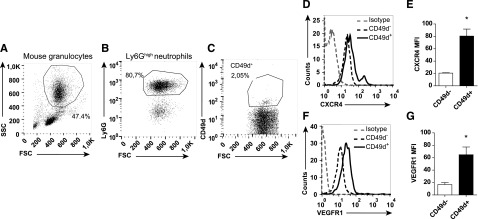
Mouse neutrophils expressing CD49d show high levels of CXCR4 and VEGFR1. Representative flow cytometry plots of mouse neutrophils isolated from blood, (A) gated in FSC/SSC and on (B) Ly6G expression, and (C) labeled with mAb toward CD49d. (D-G) Representative histograms and quantified MFIs of the CD49d+ and CD49d– neutrophils after staining with CXCR4 and VEGFR1 mAbs (n = 8-16 mice). *P < .05.