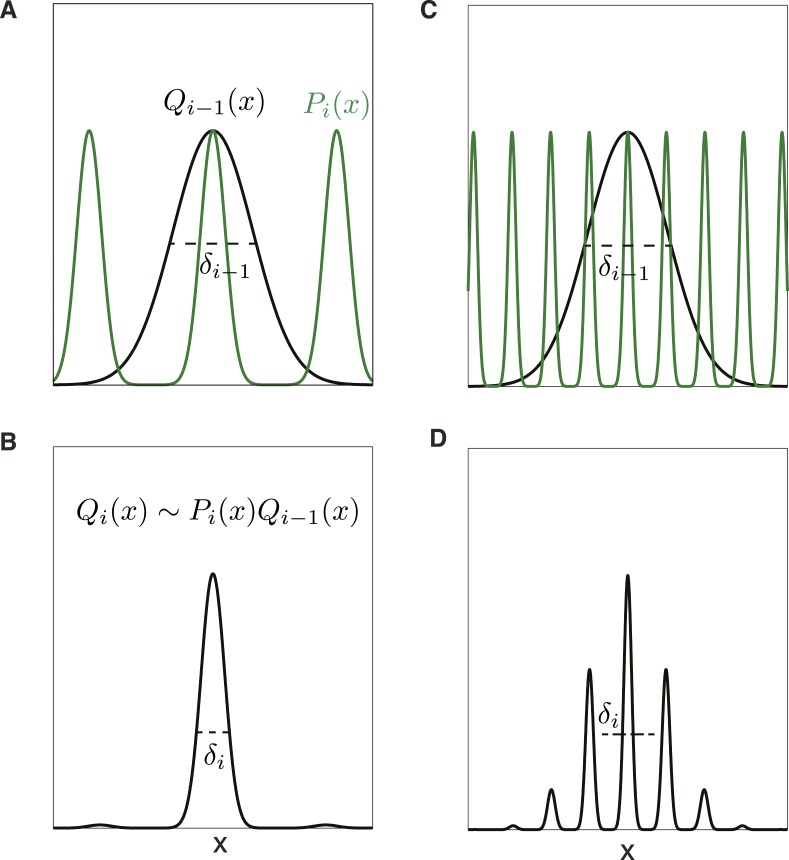
Figure 2. Trade-off between precision and ambiguity in the probabilistic decoder.
(A) The probability of position x given the responses of all grid cells at scales larger than module i is described by the distribution Qi−1(x) (black curve), and the uncertainty in position is given by the standard deviation δi−1. The probability of position given just the responses in module i will be a periodic function Pi(x) (green curve). (B) The probability distribution over position x after combining module i with all larger scales is Qi(x) ∼ Pi(x)Qi−1(x) and has reduced uncertainty δi. (C) Precision can be improved by increasing the scale factor, thereby narrowing the peaks of Pi(x). However, the periodicity shrinks as well, increasing ambiguity. (D) The distribution over position Qi(x) from combining the modules shown in C. Ambiguity from the secondary peaks leads to an overall uncertainty δi larger than in B, despite the improved precision from the narrower central peak.

