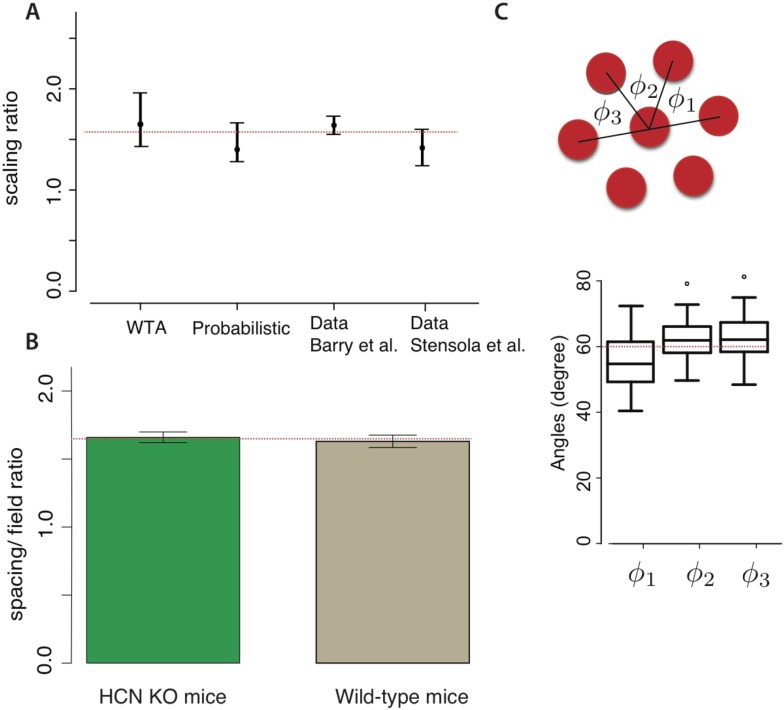
Figure 4. Comparison with experiment.
(A) Our models predict grid scaling ratios that are consistent with experiment. ‘WTA’ (winner-take-all) and ‘probabilistic’ represent predictions from two decoding models; the dot is the scaling ratio minimizing the number of neurons, and the bars represent the interval within which the neuron number will be no more than 5% higher than the minimum. For the experimental data, the dot represents the mean measured scale ratio, and the error bars represent ± one standard deviation. Data were replotted from Barry et al. (2007); Stensola et al. (2012). The dashed red line shows a consensus value running through the two theoretical predictions and the two experimental datasets. (B) The mean ratio between grid periodicity (λi) and the diameter of grid fields (li) in mice (data from Giocomo et al., 2011a). Error bars indicate ± one S.E.M. For both wild-type mice and HCN knockouts (which have larger grid periodicities), the ratio is consistent with (dashed red line). (C) The response lattice of grid cells in rats forms an equilateral triangular lattice with 60° angles between adjacent lattice edges (replotted from Hafting et al., 2005, n = 45 neurons from six rats). Dots represent outliers, as reported in Hafting et al. (2005).

