. 2015 Sep 29;4:e09423. doi: 10.7554/eLife.09423

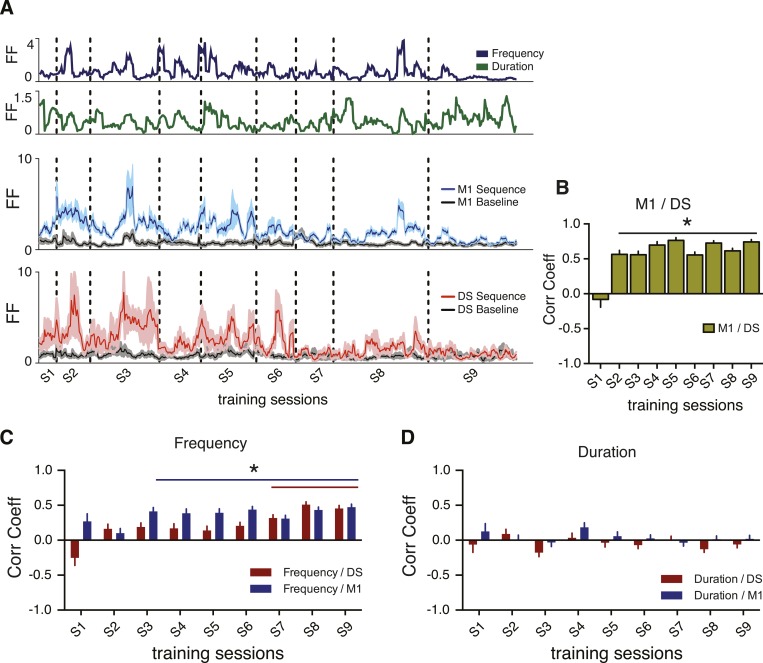
Figure 6. Correlations between corticostriatal and behavioral variability emerge for specific behavioral features.

(A) Example traces from a single animal representing variability, calculated as the Fano factor, using a moving window of five consecutive trials shifted by one for sequence frequency (dark blue trace), sequence duration (green trace), M1 units firing rate during sequences (blue trace) and baseline (grey trace), and DS units firing rate during sequences (red trace) and baseline (grey trace). Vertical dashed lines represent separation of different training sessions. Shaded areas correspond to mean ± SEM. (B) Correlation between the variability (FF) in M1 and DS. (C, D) Correlation between variability traces from neuronal firing rates in M1 (blue bars) or DS (red bars), and variability of sequence frequency or duration. Error bars denote correlation coefficient ±standard error of the correlation. *p < 0.05.

DOI: http://dx.doi.org/10.7554/eLife.09423.013

Figure 6.

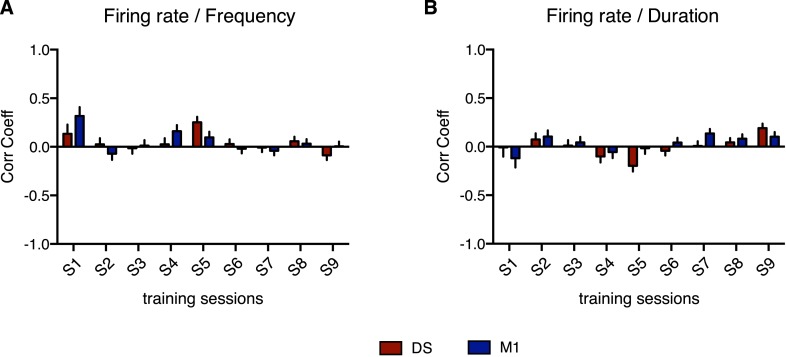
Figure 6—figure supplement 1. No significant correlation was found between average firing rate and any of the behavior features.

Figure 6—figure supplement 1.

Correlation between the firing rate and (A) sequence frequency or (B) sequence duration. Error bars denote correlation coefficient ±standard error of the correlation.
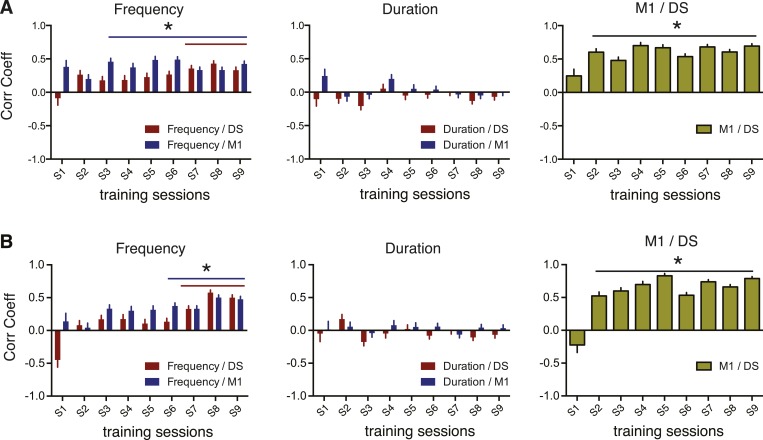
Figure 6—figure supplement 2. Changing the number of trials used for Fano factor calculation did not affect the observed corticostriatal and neuronal/behavioral variability correlations.

Figure 6—figure supplement 2.

(A, B) Correlation between variability traces from neuronal firing rates of cortical and striatal units, and between neuronal variability and variability of sequence frequency and duration using 3 (A) or 7 (B) consecutive trials. Error bars denote correlation coefficient ±standard error of the correlation. *p < 0.05.