
FIGURE 2.
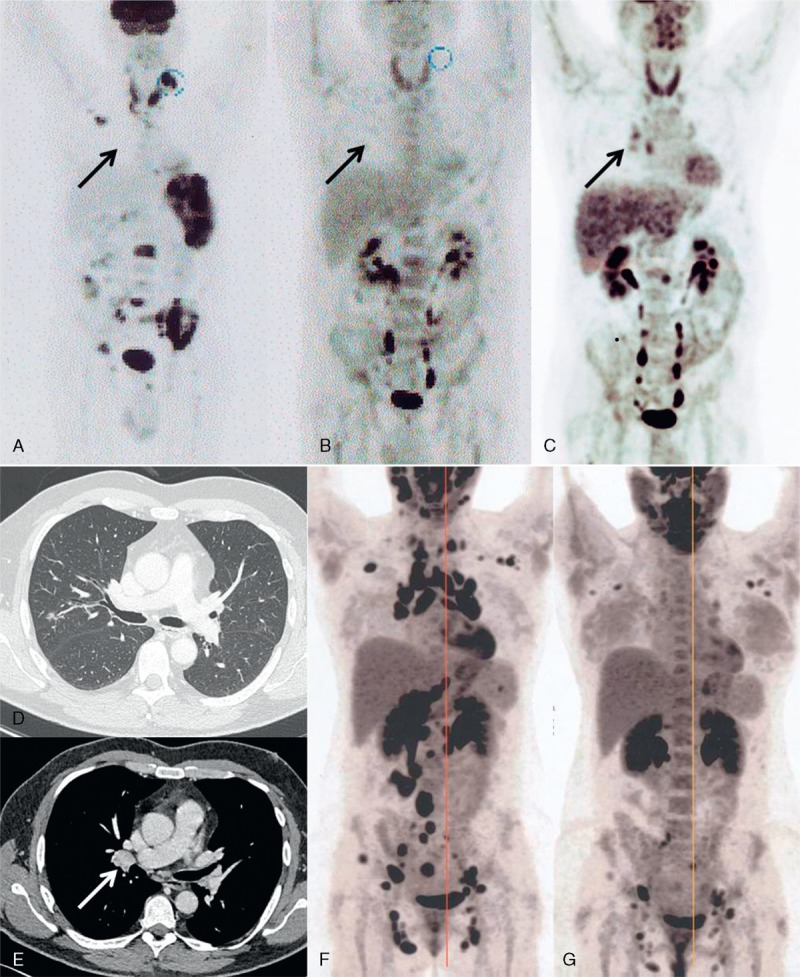
Radiological evolution of lymphoma and sarcoidosis. Positron Emission Tomography/Computerized Tomography (18FDG-PET/CT) of patient 1 at lymphoma diagnosis (A), lymphoma remission after diagnostic splenectomy and chemotherapy (B) and at sarcoidosis diagnosis 2 months later (C). Black arrow indicates the occurrence of moderately hypermetabolic (SUVmax = 3.5) hilar lymphadenopathy at sarcoidosis onset. CT scan at sarcoidosis diagnosis of patient 1 (D and E) shows micronodules in the middle lobe (D) and a 19 mm hilar enlarged lymph node (white arrow, panel E). Panel F and G are 18FDG-PET/CT evaluations of patient 2 at sarcoidosis diagnosis (F) and at last follow-up, 6 months after introduction of steroid treatment (panel G) showing a very good PR. PR = partial response, SUV = standardized uptake value.